
अवलोकन
यह रणनीति एक मात्रात्मक ट्रेडिंग प्रणाली है जिसमें एक त्वरित अस्थिरता संकेतक (AC) और एक यादृच्छिक संकेतक (Stochastic) शामिल है। यह मूल्य और तकनीकी संकेतक के बीच विचलन की पहचान करके बाजार की गतिशीलता में बदलाव को पकड़ता है, जिससे संभावित रुझानों का पूर्वानुमान लगाया जा सकता है। यह रणनीति संकेत की विश्वसनीयता बढ़ाने के लिए समानांतर (SMA) और अपेक्षाकृत कमजोर संकेतक (RSI) को भी एकीकृत करती है, और जोखिम को नियंत्रित करने के लिए एक निश्चित स्टॉप-लॉस सेट करती है।
रणनीति सिद्धांत
रणनीति का मुख्य तर्क कई तकनीकी संकेतकों के सह-संयोजन पर आधारित है। सबसे पहले, त्वरित अस्थिरता सूचक ((AC) की गणना की जाती है, जो कि 5 चक्र और 34 चक्र के औसत मूल्य के अंतर के माध्यम से प्राप्त किया जाता है, और फिर इसके एन चक्र के औसत को घटा दिया जाता है। साथ ही, यादृच्छिक संकेतकों के K और D मानों की गणना की जाती है, जो कि पीछे हटने के संकेतों की पुष्टि करने के लिए उपयोग किए जाते हैं। जब कीमत कम होती है और एसी सूचक उच्च होता है, तो एक bullish पीछे हटने का गठन होता है; जब कीमत अधिक होती है और एसी सूचक कम होता है, तो एक bullish पीछे हटने का गठन होता है।
रणनीतिक लाभ
- मल्टी इंडिकेटर सिंक्रोनसः AC, Stochastic और RSI के तीन संकेतकों के संयोजन के माध्यम से, झूठे संकेतों को प्रभावी ढंग से फ़िल्टर करने में सक्षम
- स्वचालित जोखिम नियंत्रणः एक निश्चित अंक के साथ एक अंतर्निहित स्टॉप-स्टॉप-लॉस सेटिंग, जो प्रत्येक ट्रेड के जोखिम को प्रभावी ढंग से नियंत्रित करती है
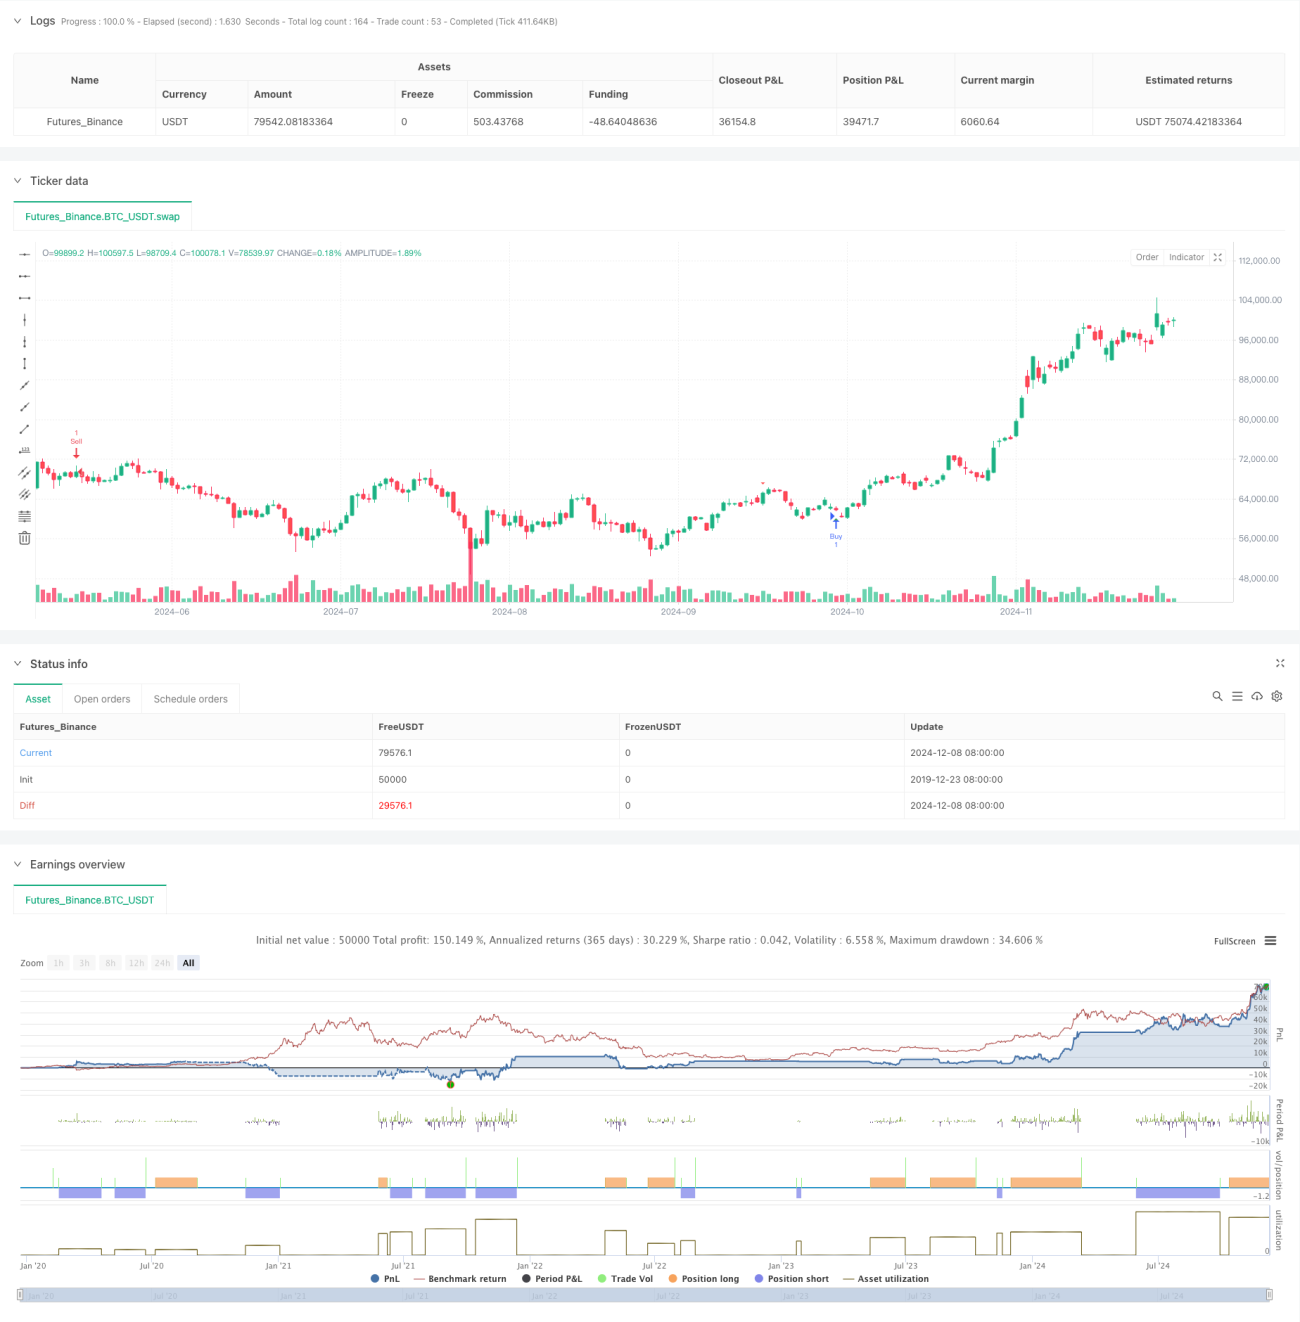
- दृश्य संकेतः व्यापारियों को अवसरों की त्वरित पहचान करने में मदद करने के लिए चार्ट पर स्पष्ट रूप से चिह्नित खरीद और बिक्री संकेत
- लचीलापनः विभिन्न बाजार स्थितियों और ट्रेडिंग चक्रों के लिए पैरामीटर समायोज्य
- रियल टाइम अलर्टः एक एकीकृत रियल टाइम अलर्ट सिस्टम सुनिश्चित करता है कि कोई भी व्यापारिक अवसर छूट न जाए
रणनीतिक जोखिम
- झूठी दरारों का खतराः अस्थिर बाजारों में झूठे विचलन के संकेत मिल सकते हैं
- स्लाइड पॉइंट जोखिमः फिक्स्ड पॉइंट स्टॉप लॉस का उपयोग करने के कारण, बाजार में भारी उतार-चढ़ाव के दौरान बड़े स्लाइड पॉइंट का सामना करना पड़ सकता है
- पैरामीटर संवेदनशीलता: विभिन्न पैरामीटर संयोजनों के कारण रणनीति प्रदर्शन में बड़े अंतर हो सकते हैं
- बाजार की परिस्थितियों पर निर्भरता: अनिश्चित बाजारों में रणनीति खराब हो सकती है
- सिग्नल विलंबता: औसत रेखा गणना के उपयोग के कारण सिग्नल में कुछ विलंबता हो सकती है
रणनीति अनुकूलन दिशा
- गतिशील स्टॉप लॉस स्टॉप लॉसः स्टॉप लॉस पॉइंट को बाजार में उतार-चढ़ाव के आधार पर गतिशील रूप से समायोजित किया जा सकता है
- लेन-देन के संकेतकों की शुरूआतः लेन-देन की पुष्टि के माध्यम से सिग्नल विश्वसनीयता में वृद्धि
- बाजार परिदृश्य फ़िल्टरिंगः प्रवृत्ति का आकलन करने के लिए मॉड्यूल जोड़ा गया, विभिन्न बाजार परिदृश्यों में विभिन्न व्यापारिक रणनीतियों का उपयोग किया गया
- अनुकूलन पैरामीटर चयनः मशीन सीखने के तरीकों का उपयोग करके प्रत्येक सूचक पैरामीटर संयोजन का अनुकूलन करें
- समय फ़िल्टरिंग बढ़ाएंः बाजार के समय की विशेषताओं को ध्यान में रखते हुए, प्रतिकूल समय पर व्यापार करने से बचें
संक्षेप
यह एक क्वांटिटेटिव ट्रेडिंग रणनीति है जिसमें कई तकनीकी संकेतकों को मिलाया गया है, जो सिग्नल से विचलित होकर बाजार के मोड़ को पकड़ने के लिए है। रणनीति का लाभ कई संकेतकों के क्रॉस-वैलिडेशन और एक अच्छी तरह से विकसित जोखिम नियंत्रण प्रणाली में है, लेकिन यह भी ध्यान रखना है कि झूठे ब्रेकआउट और पैरामीटर अनुकूलन जैसे मुद्दों को ध्यान में रखा जाना चाहिए। निरंतर अनुकूलन और सुधार के माध्यम से, रणनीति को विभिन्न बाजार स्थितियों में स्थिर प्रदर्शन बनाए रखने की उम्मीद है।
- 1