
अवलोकन
रणनीति एक व्यापक मात्रात्मक व्यापार प्रणाली है जिसमें कई औसत रेखाएं, अपेक्षाकृत कमजोर संकेतकों (आरएसआई), औसत रुझान सूचक (एडीएक्स) और लेनदेन की मात्रा विश्लेषण शामिल हैं। रणनीति को कई तकनीकी संकेतकों के सामंजस्यपूर्ण संयोजन के माध्यम से ट्रेंड की पुष्टि के आधार पर व्यापार करने के लिए, लेनदेन की मात्रा और गतिशीलता के संकेतकों को फ़िल्टर करके व्यापार की विश्वसनीयता में सुधार करने के लिए।
रणनीति सिद्धांत
रणनीति का मूल तर्क निम्नलिखित प्रमुख घटकों पर आधारित है:
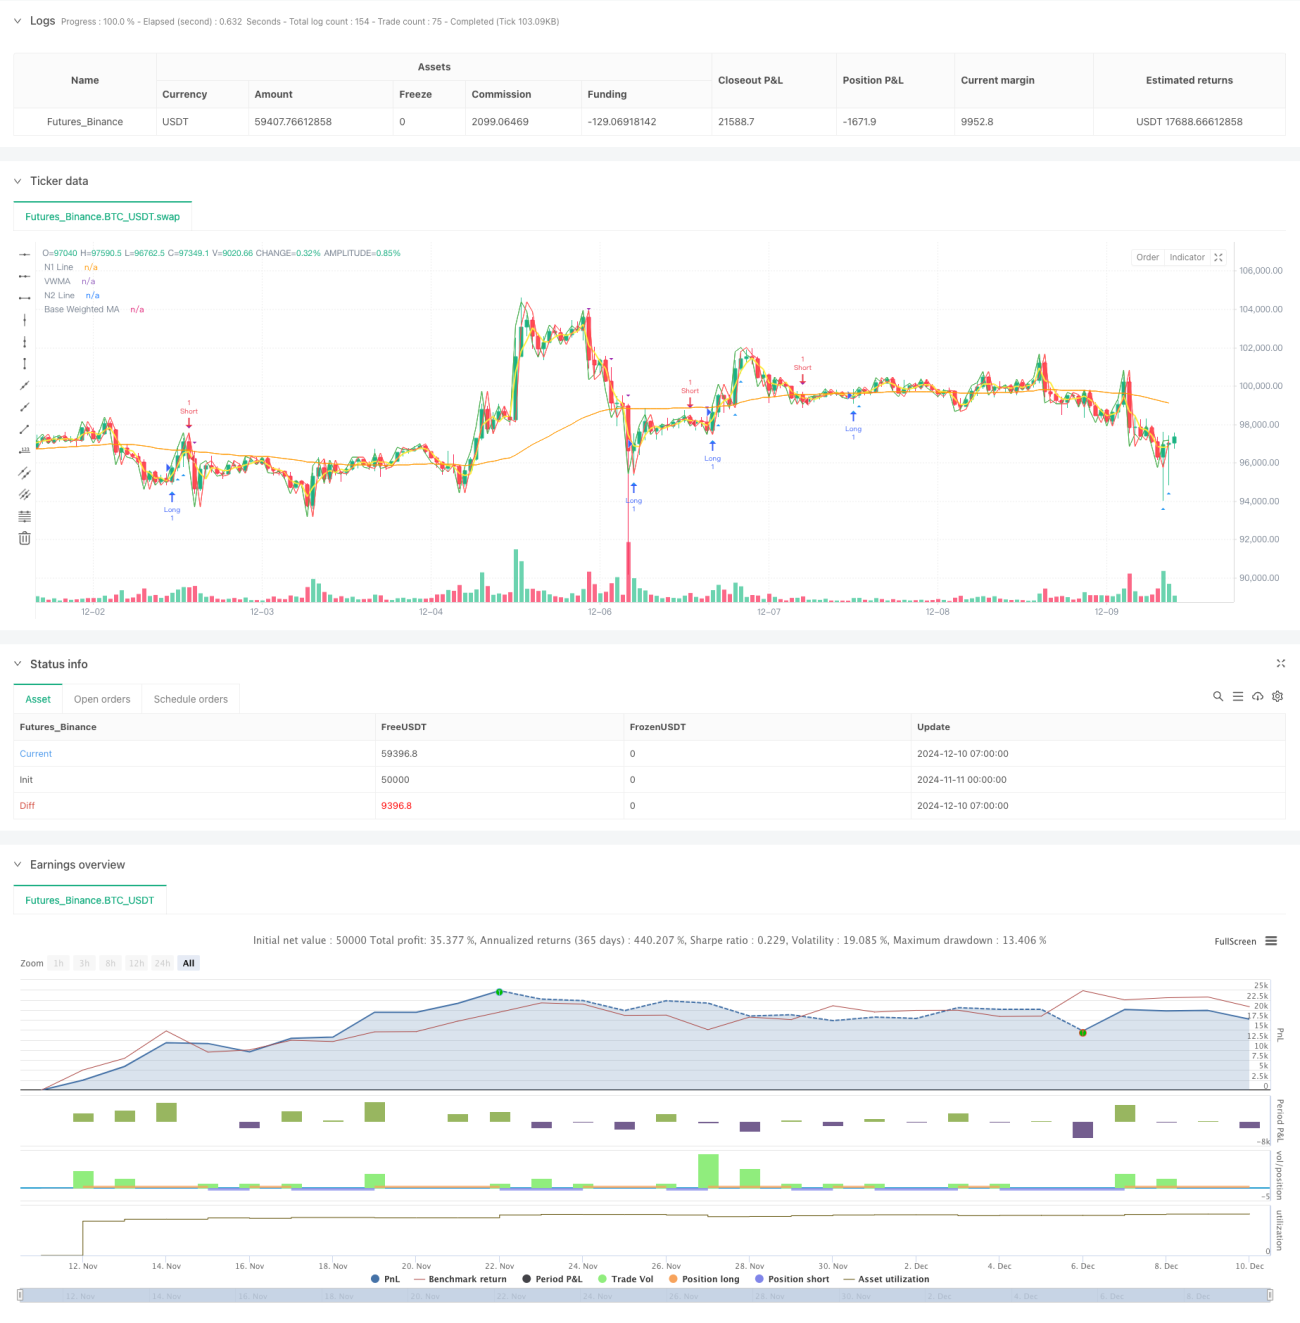
- डबल हूल औसत (Double Hull MA), व्युत्पन्न भारित चलती औसत (VWMA) और मूल भारित चलती औसत (WMA) का उपयोग करके बहु-मध्यम प्रणाली का निर्माण करें
- ADX सूचकांक के माध्यम से प्रवृत्ति की ताकत का आकलन करें, केवल जब प्रवृत्ति स्पष्ट हो तो व्यापार करें
- आरएसआई का उपयोग चरम बाजार स्थितियों को फ़िल्टर करने के लिए किया जाता है ताकि क्षेत्रीय व्यापार को खरीदने या बेचने से बचा जा सके
- व्यापारिक विश्लेषण के संयोजन के साथ, व्यापारिक संकेतों के आने पर व्यापारिक मात्रा एक निश्चित सीमा से अधिक होनी चाहिए
- n1 और n2 लाइनों के क्रॉसिंग द्वारा विशिष्ट लेनदेन की दिशा निर्धारित करें
मल्टीपल एवरेज लाइन सिस्टम कीमतों के रुझानों के लिए एक बेंचमार्क प्रदान करता है, एडीएक्स सुनिश्चित करता है कि ट्रेड केवल तब होता है जब रुझान पर्याप्त मजबूत होता है, आरएसआई को रोकने से बचने में मदद करता है, जबकि लेनदेन की मात्रा विश्लेषण यह सुनिश्चित करता है कि ट्रेड उच्च बाजार गतिविधि के दौरान होता है।
रणनीतिक लाभ
- मल्टीपल कन्फर्मेशन सिस्टम ने फर्जी घुसपैठ के जोखिम को कम किया
- तकनीकी संकेतकों और लेनदेन की मात्रा के विश्लेषण के संयोजन से लेनदेन की विश्वसनीयता बढ़ जाती है
- RSI के माध्यम से चरम बाजार स्थितियों को फ़िल्टर करें और प्रतिकूल समय में प्रवेश से बचें
- ADX का उपयोग केवल ट्रेंड के स्पष्ट होने पर ट्रेडिंग सुनिश्चित करने के लिए किया जाता है, जिससे जीत की दर बढ़ जाती है
- लेन-देन की मात्रा बाजार सहमति की पुष्टि करने में मदद करती है
- रणनीति तर्क स्पष्ट है और पैरामीटर अत्यधिक समायोज्य हैं
रणनीतिक जोखिम
- कई फ़िल्टरिंग स्थितियों के कारण कुछ व्यापारिक अवसरों को याद किया जा सकता है
- बाजार में उतार-चढ़ाव के बीच खराब प्रदर्शन की संभावना
- पैरामीटर अनुकूलन से ओवरफिटिंग हो सकती है
- औसत रेखा प्रणाली तेजी से पलटने की स्थिति में देरी से प्रतिक्रिया कर सकती है
- कम तरलता वाले बाजारों में लेन-देन के अवसरों को प्रतिबंधित करने के लिए लेन-देन फ़िल्टर
जोखिम को निम्न तरीकों से प्रबंधित करने की सलाह दी जाती हैः
- विभिन्न बाजार विशेषताओं के अनुसार पैरामीटर को समायोजित करें
- उचित रोकथाम सेट करें
- प्रत्येक लेनदेन के लिए पूंजी अनुपात को नियंत्रित करें
- नियमित रूप से सत्यापन रणनीति की प्रभावशीलता की जांच करें
रणनीति अनुकूलन दिशा
- बाजार की स्थितियों के अनुसार गतिशील रूप से समायोजन करने के लिए अनुकूली पैरामीटर तंत्र का परिचय दें
- बाजार में उतार-चढ़ाव के लिए फ़िल्टर जोड़ें, उच्च उतार-चढ़ाव के दौरान स्थिति को समायोजित करें
- खेल से बाहर निकलने की व्यवस्था में सुधार, नुकसान को ट्रैक करने के लिए विचार
- आदान-प्रदान फ़िल्टर को अनुकूलित करें, सापेक्ष आदान-प्रदान को ध्यान में रखते हुए, पूर्ण नहीं
- समय फ़िल्टर जोड़ें और महत्वपूर्ण समाचारों को पोस्ट करने से बचें
- बाजार जोखिम की पहचान करने के लिए मूल्य उतार-चढ़ाव के संकेतकों को शामिल करने पर विचार करें
संक्षेप
इस रणनीति का मुख्य विशेषता यह है कि यह कई पुष्टि के माध्यम से ट्रेडों की विश्वसनीयता को बढ़ाता है, जबकि विभिन्न प्रकार के फ़िल्टरों के माध्यम से जोखिम को नियंत्रित करता है। हालांकि कुछ व्यापार के अवसरों को याद किया जा सकता है, लेकिन यह व्यापार की स्थिरता में सुधार करने में मदद करता है। इस रणनीति के लिए और भी सुधार के लिए जगह है।
- 1