एक प्रवृत्ति-अनुसरण मात्रात्मक व्यापार रणनीति जो मासिक चलती औसत फिल्टर के साथ ऐतिहासिक उच्च सफलता को जोड़ती है

अवलोकन
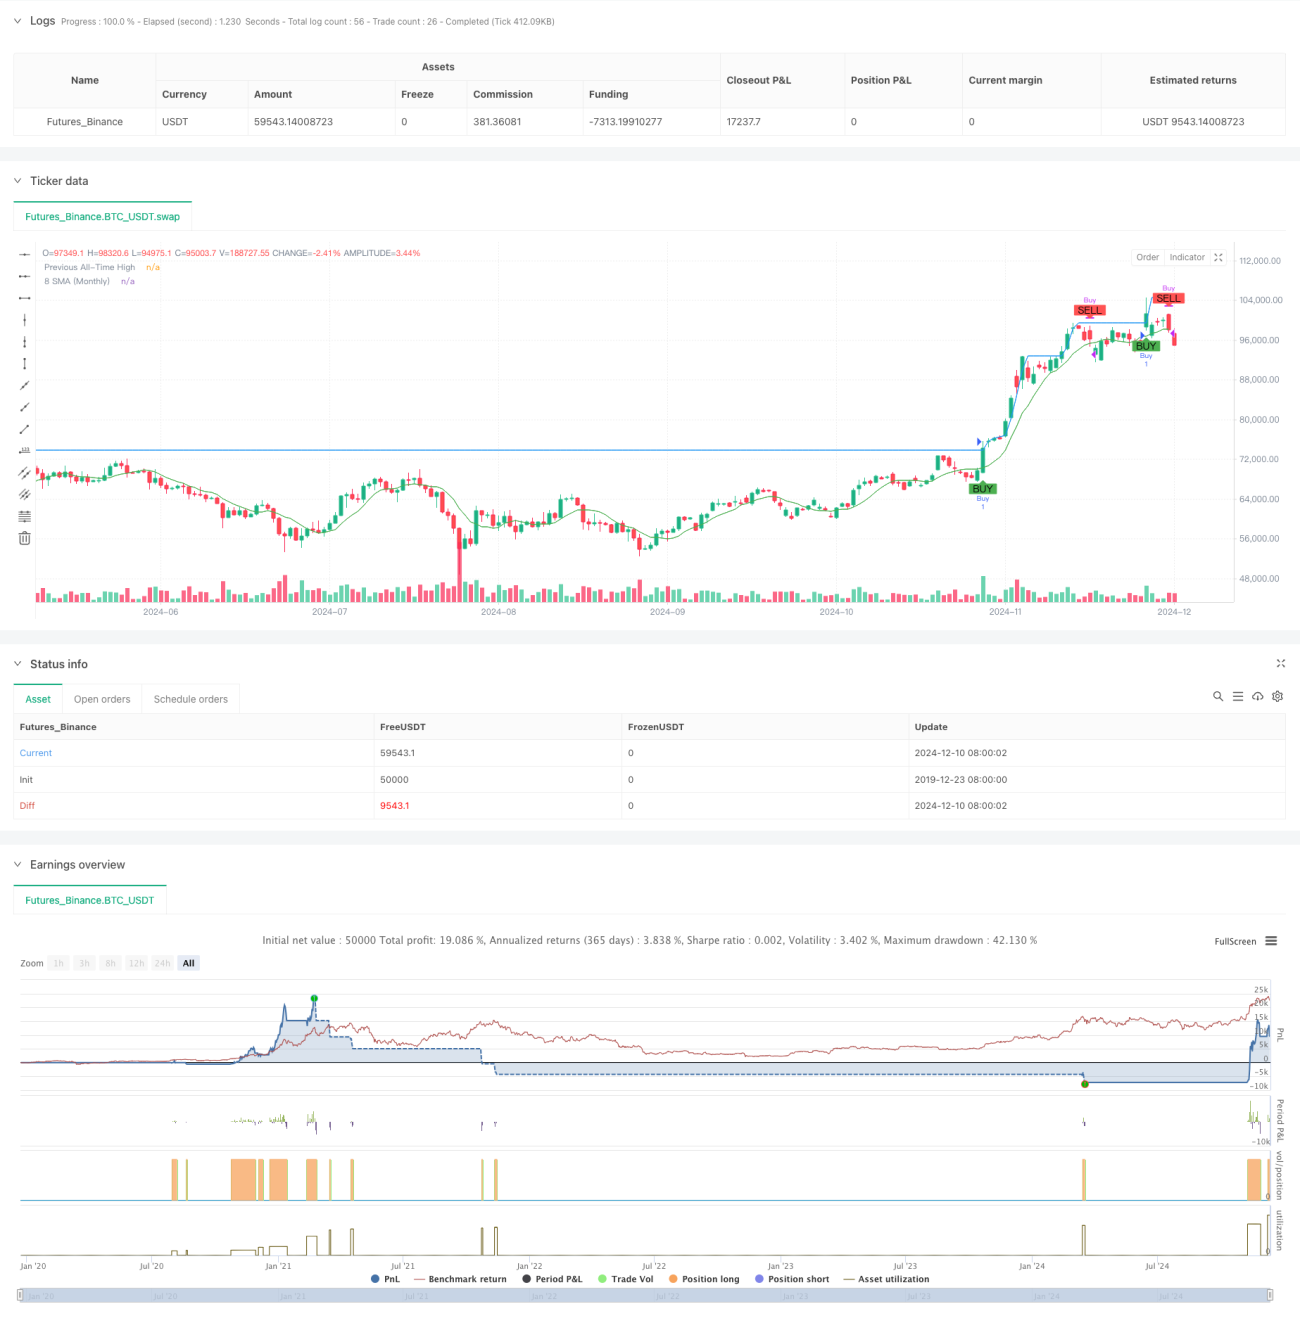
यह रणनीति एक ट्रेंड ट्रैकिंग रणनीति है, जो ऐतिहासिक नए उच्च के आधार पर और एक चंद्र रेखा औसत रेखा फ़िल्टर पर आधारित है। यह खरीद संकेतों की तलाश करने के लिए यह देखते हुए कि क्या कीमतों ने पिछले ऐतिहासिक उच्चतम बिंदु को तोड़ दिया है, जबकि 8 चक्र सरल चलती औसत ((8 एसएमए) का उपयोग करने के लिए किया जाता है। यह रणनीति डिजाइन अवधारणा "प्रवृत्ति की निरंतरता" के बाजार की विशेषता के अनुरूप है, जो विशेष रूप से मजबूत ऊपर की ओर बढ़ने वाले रुझानों के बीच बड़े स्तर के व्यवहार को पकड़ने के लिए उपयुक्त है।
रणनीति सिद्धांत
इस रणनीति के मूल में दो महत्वपूर्ण तत्व शामिल हैंः
- खरीदें सिग्नलः जब नवीनतम समापन मूल्य पिछले अवधि के इतिहास के उच्चतम बिंदु को तोड़ता है (वर्तमान K लाइन के उच्चतम मूल्य को छोड़कर), सिस्टम एक खरीद संकेत उत्पन्न करता है। यह शर्त केवल स्पष्ट ऊपर की ओर बढ़ने की स्थिति में प्रवेश सुनिश्चित करती है।
- बेचने का संकेत: जब चन्द्र रेखा के समापन की कीमत 8 चक्र सरल चलती औसत से नीचे गिरती है, तो सिस्टम एक बेचने का संकेत देता है। यह स्थिति समय पर नुकसान को रोकने में मदद करती है, जिससे प्रवृत्ति में बदलाव से अधिक नुकसान नहीं होता है।
इस रणनीति में सिग्नल स्टेट ट्रैकिंग के लिए भी डिज़ाइन किया गया है ताकि सिग्नल को एक ही स्थिति में बार-बार उत्पन्न न किया जा सके, जिससे रणनीति की स्थिरता में वृद्धि हो सके।
रणनीतिक लाभ
- प्रवृत्ति पकड़ने की क्षमता मजबूतः ऐतिहासिक उच्च और उच्च के माध्यम से प्रवृत्ति को प्रभावी ढंग से पकड़ने में सक्षम है।
- जोखिम नियंत्रण में सुधारः फ़िल्टर की स्थिति के रूप में चंद्रमा और औसत रेखा के संयोजन के साथ, झूठी दरारों को प्रभावी ढंग से फ़िल्टर किया जा सकता है।
- उच्च सिग्नल स्थिरता: सिग्नल स्थिति को lastSignal चर के माध्यम से ट्रैक करें, ताकि दोहराए जाने वाले सिग्नल उत्पन्न न हों।
- अच्छा दृश्य प्रभावः रणनीति एक स्पष्ट ग्राफिकल इंटरफ़ेस प्रदान करती है, जिसमें ऐतिहासिक उच्च बिंदु रेखा, औसत रेखा और खरीद और बिक्री सिग्नल मार्कर शामिल हैं।
- अनुकूलनशीलताः रणनीति को विभिन्न समय अवधि और किस्मों में लागू किया जा सकता है।
रणनीतिक जोखिम
- विलंबता का जोखिमः नए रिकॉर्ड ऊंचाई के संकेतों में कुछ विलंबता होती है, जो सबसे अच्छा प्रवेश समय से चूक सकती है।
- झूठी सफलता का जोखिमः चन्द्र रेखाओं के समान फ़िल्टर होने के बावजूद, अस्थिर बाजारों में झूठी सफलता की संभावना है।
- पीछे हटने का जोखिमः रुझान के मोड़ पर, रणनीति अधिक पीछे हटने का सामना कर सकती है।
- धन प्रबंधन जोखिमः रणनीति में स्थिति प्रबंधन तंत्र शामिल नहीं है, अतिरिक्त धन प्रबंधन नियमों की आवश्यकता है।
रणनीति अनुकूलन दिशा
- इनपुट मात्रा की पुष्टिः सिग्नल की विश्वसनीयता में सुधार के लिए एक सफलता पुष्टि शर्त के रूप में एक इनपुट मात्रा संकेतक जोड़ा जा सकता है।
- बेहतर रोकथाम तंत्र: अधिक लचीले रोकथाम नियमों को डिजाइन किया जा सकता है, जैसे कि ट्रैकिंग रोकथाम या अस्थिरता रोकथाम।
- स्थिति प्रबंधन जोड़ेंः बाजार में उतार-चढ़ाव और प्रवृत्ति की ताकत के आधार पर स्थिति आकार को गतिशील रूप से समायोजित करें।
- सिग्नल फ़िल्टरिंग को अनुकूलित करेंः रुझान की ताकत के संकेतकों को जोड़ें, जैसे कि एडीएक्स, और आगे के कमजोर संकेतों को फ़िल्टर करें।
- समय फ़िल्टर जोड़ेंः समय चक्र फ़िल्टर जोड़ें ताकि आप अनुचित समय पर व्यापार न कर सकें।
संक्षेप
यह एक तर्कसंगत, तर्कसंगत और स्पष्ट प्रवृत्ति ट्रैकिंग रणनीति है। ऐतिहासिक नए उच्च ब्रेकडाउन और चंद्रमा की औसत रेखा के संयोजन के माध्यम से, प्रवृत्ति पर प्रभावी पकड़ की गारंटी दी जाती है और जोखिम पर उचित नियंत्रण किया जाता है। हालांकि कुछ पिछड़ेपन और झूठे ब्रेकडाउन का जोखिम है, लेकिन अनुशंसित अनुकूलन दिशा के माध्यम से, रणनीति का समग्र प्रदर्शन और भी बेहतर होने की उम्मीद है। यह रणनीति स्पष्ट रूप से प्रवृत्ति वाले बाजार के वातावरण में लागू करने के लिए विशेष रूप से उपयुक्त है और मध्यम और दीर्घकालिक निवेश के लिए एक महत्वपूर्ण संदर्भ उपकरण के रूप में कार्य कर सकती है।
- 1