एकाधिक तकनीकी संकेतक क्रॉस ट्रेंड ट्रैकिंग रणनीति: आरएसआई और स्टोचैस्टिक आरएसआई सहयोगी ट्रेडिंग सिस्टम

अवलोकन
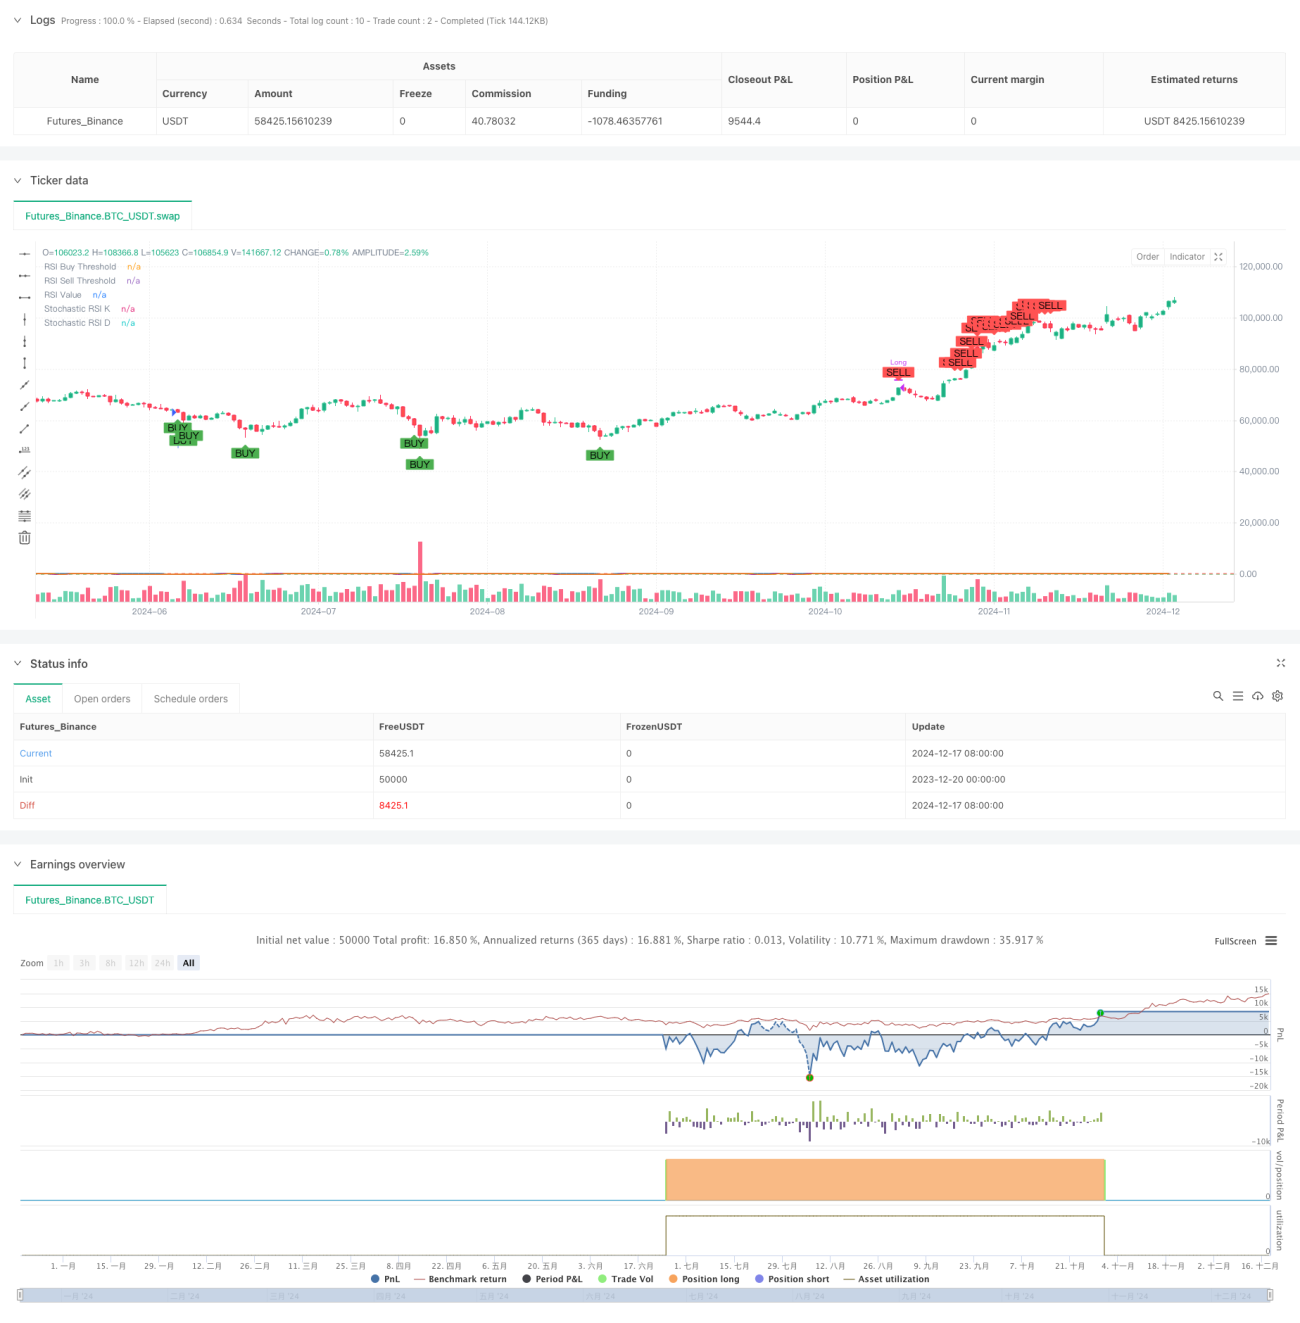
यह रणनीति एक ट्रेंड ट्रैकिंग ट्रेडिंग सिस्टम है जो अपेक्षाकृत कमजोर संकेतकों (RSI) और यादृच्छिक अपेक्षाकृत कमजोर संकेतकों (Stochastic RSI) पर आधारित है। यह रणनीति RSI और Stochastic RSI के ओवरबॉट और ओवरसोल्ड स्तरों की निगरानी करके बाजार में ओवरबॉट या ओवरसोल्ड संकेत होने पर ट्रेड करती है। यह रणनीति डेली और साप्ताहिक समय चक्र पर चलने का समर्थन करती है, जिससे व्यापारियों को लचीला व्यापार विकल्प मिलता है।
रणनीति सिद्धांत
रणनीति मुख्य रूप से दो तकनीकी संकेतकों पर आधारित होती हैः आरएसआई और स्टोकेस्टिक आरएसआई। आरएसआई मूल्य परिवर्तन की गति और आयाम को मापने के लिए उपयोग किया जाता है, जबकि स्टोकेस्टिक आरएसआई आरएसआई मानों की यादृच्छिक सूचक गणना के माध्यम से अधिक संवेदनशील बाजार ओवरबॉट ओवरसोल सिग्नल प्रदान करता है। एक खरीद संकेत आरएसआई 35 से कम और स्टोकेस्टिक आरएसआई के के मूल्य 20 से कम के साथ ट्रिगर किया जाता है, यह दर्शाता है कि बाजार ओवरसोल में है; एक बेचने का संकेत आरएसआई 70 से अधिक और स्टोकेस्टिक आरएसआई के के मूल्य 80 से अधिक के साथ ट्रिगर किया जाता है, यह दर्शाता है कि बाजार ओवरबॉट में है।
रणनीतिक लाभ
- दोहरी पुष्टिकरण तंत्रः RSI और Stochastic RSI दोनों संकेतकों के संयोजन के माध्यम से, झूठे संकेतों के प्रभाव को कम करता है।
- लचीला समय चक्रः विभिन्न ट्रेडिंग शैलियों के लिए डेली और साउंडलाइन समय चक्रों पर चलने का समर्थन करता है।
- पैरामीटर समायोज्यः व्यापारी आरएसआई और स्टोकेस्टिक आरएसआई के पैरामीटर को बाजार की स्थिति के अनुसार समायोजित कर सकते हैं।
- अच्छा दृश्य प्रभावः रणनीति स्पष्ट खरीद और बिक्री सिग्नल और सूचक रेखाओं का दृश्य प्रदर्शन प्रदान करती है।
- मजबूत प्रणालीः स्पष्ट प्रवेश और निकास नियमों के साथ स्पष्ट रणनीति तर्क।
रणनीतिक जोखिम
- अस्थिर बाजार जोखिमः अस्थिर बाज़ारों में बार-बार ट्रेडिंग सिग्नल उत्पन्न हो सकते हैं, जिससे ट्रेडिंग की लागत बढ़ जाती है।
- रुझान उलटा जोखिमः मजबूत रुझान वाले बाजारों में, रणनीति ओवरबॉय ओवरसोल सिग्नल के कारण अग्रिम रूप से बंद हो सकती है, जिससे बड़ी घटनाओं से चूक जाती है।
- पैरामीटर संवेदनशीलताः विभिन्न पैरामीटर सेटिंग्स के कारण लेनदेन के परिणामों में काफी अंतर हो सकता है।
- विलंबता का जोखिमः तकनीकी संकेतक स्वाभाविक रूप से विलंबता के कारण हैं, जो प्रवेश और प्रस्थान के समय में थोड़ी देरी का कारण बन सकता है।
रणनीति अनुकूलन दिशा
- प्रवृत्ति फ़िल्टर का परिचयः प्रवृत्ति संकेतकों जैसे कि चलती औसत को जोड़ा जा सकता है, और ट्रेडिंग सिग्नल केवल तभी निष्पादित किया जा सकता है जब प्रवृत्ति स्पष्ट हो।
- अनुकूलन पैरामीटर अनुकूलनः गतिशील पैरामीटर समायोजन तंत्र विकसित करें, जिससे पैरामीटर बाजार की अस्थिरता के अनुसार स्वचालित रूप से समायोजित हो सकें।
- बढ़ी हुई हानि तंत्रः एटीआर या निश्चित प्रतिशत के आधार पर हानि की शर्तें सेट करें, जोखिम को नियंत्रित करें।
- संचयी संचयी संचयी संकेतक, सिग्नल की विश्वसनीयता में सुधार।
- सिग्नल शक्ति स्कोर विकसित करना: सिग्नल शक्ति स्कोर प्रणाली स्थापित करना, विभिन्न सिग्नल शक्तियों के अनुसार स्थिति आकार को समायोजित करना।
संक्षेप
यह रणनीति आरएसआई और स्टोकेस्टिक आरएसआई के लाभों के संयोजन के माध्यम से एक अपेक्षाकृत विश्वसनीय व्यापार प्रणाली का निर्माण करती है। हालांकि कुछ सीमाएं हैं, उचित जोखिम प्रबंधन और निरंतर अनुकूलन के साथ, रणनीति का अच्छा व्यावहारिक मूल्य है। व्यापारियों को सलाह दी जाती है कि वे वास्तविक उपयोग से पहले विभिन्न पैरामीटर संयोजनों का पूरी तरह से परीक्षण करें और बाजार की स्थिति और व्यक्तिगत जोखिम वरीयताओं के साथ उचित समायोजन करें।
- 1