दीर्घकालिक प्रवृत्ति एसएमए मूविंग एवरेज क्रॉसओवर मात्रात्मक रणनीति

अवलोकन
यह रणनीति बहु-अवधि सरल मूविंग औसत (एसएमए) क्रॉसओवर संकेतों पर आधारित एक मात्रात्मक व्यापार प्रणाली है। यह मुख्य रूप से दीर्घकालिक तेजी के भीतर अल्पकालिक पुलबैक अवसरों की पहचान करके व्यापार करता है। यह रणनीति चलती औसत के स्थिति संबंध और क्रॉसओवर संकेतों के माध्यम से बाजार के रुझान और व्यापार के अवसरों का आकलन करने के लिए 5 दिन, 10 दिन, 20 दिन, 60 दिन और 120 दिन की पांच अवधियों के साथ एसएमए संकेतकों का उपयोग करती है।
रणनीति सिद्धांत
रणनीति के मूल तर्क में निम्नलिखित प्रमुख भाग शामिल हैं:
- SMA20 और SMA60 के बीच सापेक्ष स्थिति संबंध से दीर्घकालिक प्रवृत्ति का अंदाजा लगाया जा सकता है। जब SMA20 SMA60 से ऊपर होता है, तो यह पुष्टि होती है कि बाजार ऊपर की ओर बढ़ रहा है।
- दीर्घकालिक अपट्रेंड की पुष्टि के आधार पर, खरीद संकेत तब ट्रिगर होता है जब अल्पकालिक SMA5 SMA20 से नीचे से ऊपर की ओर उछलता है। इससे पता चलता है कि बाजार में तेजी के रुझान में अल्पकालिक गिरावट के बाद उछाल आ रहा है।
- जब SMA20, SMA5 को पार करता है, तो समापन संकेत सक्रिय हो जाता है। इससे संकेत मिलता है कि अल्पावधि में ऊपर की ओर बढ़ने की गति कमजोर पड़ गई है और समायोजन की अवधि में प्रवेश कर सकती है।
- इस रणनीति में एक समय फ़िल्टर फ़ंक्शन भी शामिल है, जो बैकटेस्ट की समय सीमा को सीमित कर सकता है और रणनीति के लचीलेपन को बढ़ा सकता है।
रणनीतिक लाभ
- रणनीति का तर्क स्पष्ट और सरल है, इसे समझना और लागू करना आसान है, तथा इसमें जटिल गणना प्रक्रिया शामिल नहीं है।
- समन्वय में कई अवधि के मूविंग औसत का उपयोग करके, हम प्रभावी रूप से बाजार के शोर को फ़िल्टर कर सकते हैं और ट्रेडिंग संकेतों की विश्वसनीयता में सुधार कर सकते हैं।
- यह रणनीति ट्रेंडिंग बाजारों में पुलबैक अवसरों पर ध्यान केंद्रित करती है, जो "ट्रेंड ट्रेडिंग" की मूल अवधारणा के अनुरूप है।
- ईएमए के स्थान पर एसएमए का उपयोग करने से मूल्य परिवर्तनों के प्रति संवेदनशीलता कम हो जाती है और झूठे संकेतों में कमी आती है।
- प्रवेश और निकास का तर्क स्पष्ट है, जो निष्पादन और जोखिम नियंत्रण को सुविधाजनक बनाता है।
रणनीतिक जोखिम
- चलती औसत प्रणाली में विलम्ब होता है, जिसके कारण प्रवेश और निकास का समय इष्टतम नहीं हो पाता।
- अस्थिर बाजार में, लगातार चलती औसत क्रॉसओवर बहुत सारे गलत संकेत उत्पन्न कर सकते हैं।
- इस रणनीति में अस्थिरता को छानने की प्रणाली का अभाव है और उच्च अस्थिरता की अवधि के दौरान इसमें गिरावट का जोखिम अधिक हो सकता है।
- ट्रेडिंग वॉल्यूम जैसे अन्य तकनीकी संकेतकों के सहयोग पर विचार किए बिना, सिग्नल की विश्वसनीयता में सुधार करने की आवश्यकता है।
- निश्चित चल औसत पैरामीटर सभी बाजार परिवेशों के लिए उपयुक्त नहीं हो सकते हैं।
रणनीति अनुकूलन दिशा
- अस्थिरता को फ़िल्टर करने के लिए एटीआर संकेतक का उपयोग करें और जब अस्थिरता बहुत अधिक हो तो ट्रेडिंग से बचें।
- ट्रेडिंग सिग्नल की विश्वसनीयता में सुधार करने के लिए वॉल्यूम पुष्टिकरण तंत्र जोड़ें।
- रणनीति को विभिन्न बाजार परिवेशों के लिए बेहतर रूप से अनुकूलित करने के लिए एक अनुकूली चल औसत चक्र तंत्र विकसित करना।
- मजबूत रुझानों में व्यापार सुनिश्चित करने के लिए ADX संकेतक जैसे रुझान शक्ति फिल्टर जोड़ें।
- जोखिमों पर बेहतर नियंत्रण के लिए स्टॉप-लॉस तंत्र में सुधार करें, जैसे ट्रेलिंग स्टॉप जोड़ना।
संक्षेप
यह रणनीति बहु-अवधि एसएमए मूविंग एवरेज का उपयोग करके एक ट्रेडिंग सिस्टम का निर्माण करती है जो दीर्घकालिक ऊर्ध्व प्रवृत्तियों में पुलबैक अवसरों को पकड़ने पर केंद्रित होती है। रणनीति का डिजाइन संक्षिप्त और व्यावहारिक है, तथा इसकी समझ और कार्यान्वयन क्षमता अच्छी है। अस्थिरता फ़िल्टरिंग और वॉल्यूम पुष्टि जैसे अनुकूलन उपायों को शुरू करने से, रणनीति की मजबूती और विश्वसनीयता में और सुधार होने की उम्मीद है।
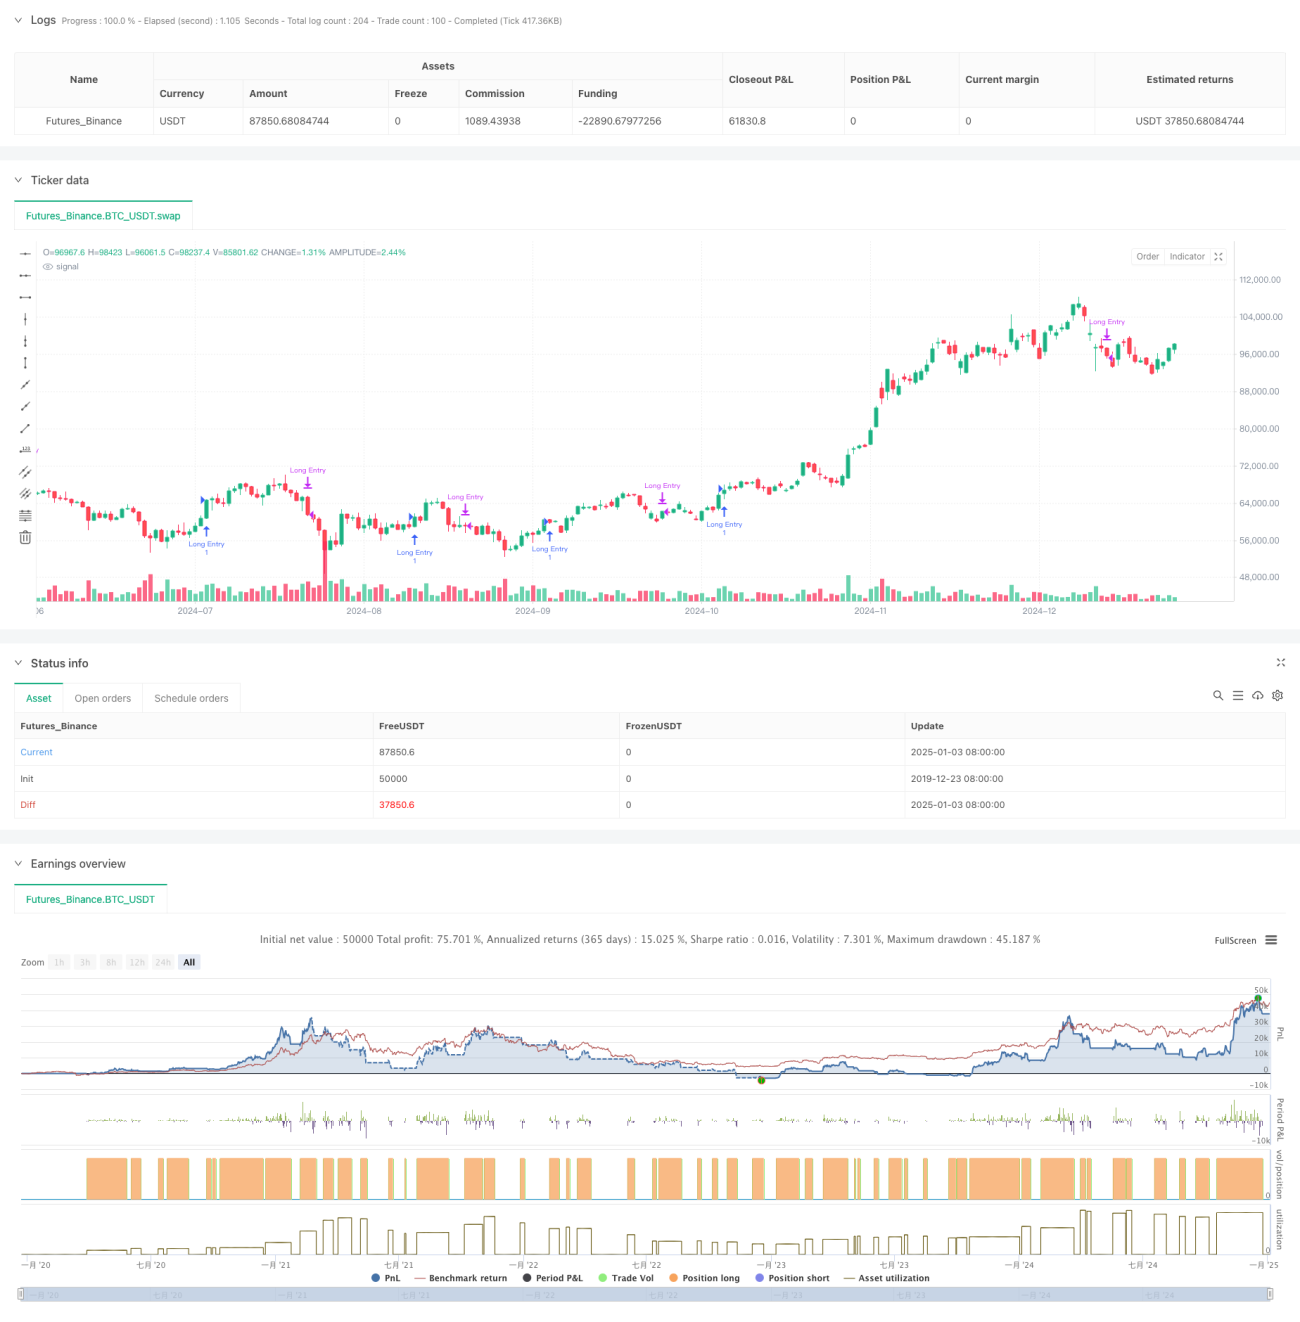
/*backtest
start: 2019-12-23 08:00:00
end: 2025-01-04 08:00:00
period: 1d
basePeriod: 1d
exchanges: [{"eid":"Futures_Binance","currency":"BTC_USDT"}]
*/

//@version=6
strategy("Long-Term Growing Stock Strategy", overlay=true)
// Date Range
// STEP 1. Create inputs that configure the backtest's date range- 1