दोहरी चलती औसत आरएसआई प्रवृत्ति विचलन रणनीति: घातीय चलती औसत और सापेक्ष शक्ति पर आधारित एक प्रवृत्ति-पकड़ने वाली प्रणाली

अवलोकन
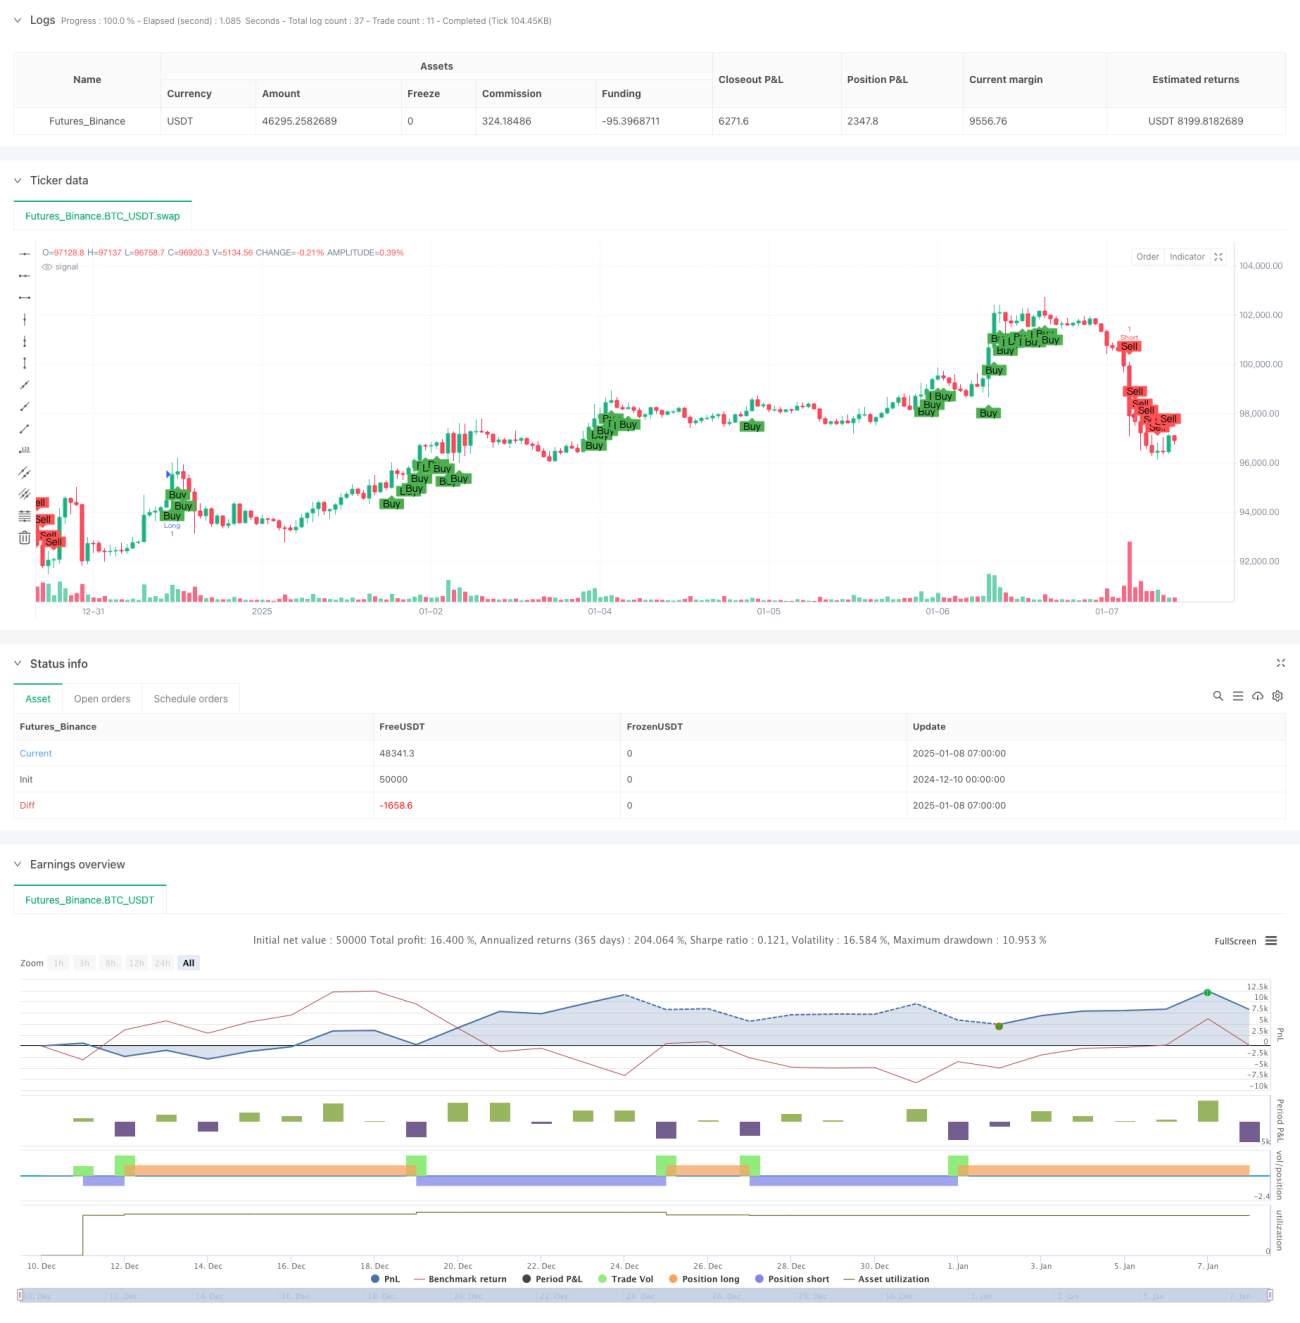
यह एक प्रवृत्ति-अनुसरण रणनीति है जो घातीय चलती औसत (ईएमए) और सापेक्ष शक्ति सूचकांक (आरएसआई) को जोड़ती है। यह रणनीति तेज और धीमी ईएमए के क्रॉसओवर पर नज़र रखती है, और आरएसआई संकेतक के ओवरबॉट और ओवरसोल्ड स्तरों के साथ-साथ आरएसआई डायवर्जेंस को मिलाकर ट्रेडिंग सिग्नल निर्धारित करती है, जिससे बाजार के रुझान को प्रभावी ढंग से समझा जा सके। यह रणनीति 1 घंटे की समयावधि पर चलती है और कई तकनीकी संकेतकों के सत्यापन के माध्यम से लेनदेन की सटीकता में सुधार करती है।
रणनीति सिद्धांत
रणनीति के मूल तर्क में निम्नलिखित प्रमुख तत्व शामिल हैं:
- ट्रेंड की दिशा निर्धारित करने के लिए 9-अवधि और 26-अवधि EMA का उपयोग करें। यदि तेज़ रेखा धीमी रेखा से ऊपर है, तो इसे ऊपर की ओर रुझान माना जाता है, अन्यथा यह नीचे की ओर रुझान है।
- 14-अवधि के आरएसआई संकेतक का उपयोग करें और दीर्घ और लघु संकेतों के लिए ट्रिगर थ्रेसहोल्ड के रूप में 65 और 35 निर्धारित करें।
- 1 घंटे की समय-सीमा पर आरएसआई विचलन का पता लगाना, मूल्य के उच्च और निम्न स्तर की तुलना आरएसआई उच्च और निम्न स्तर से करके संभावित प्रवृत्ति उत्क्रमण की पहचान करना।
- लॉन्ग ट्रेडिंग सिग्नल को निम्नलिखित शर्तों को पूरा करना होगा: तेज़ ईएमए धीमी ईएमए से ऊपर है, आरएसआई 65 से अधिक है, और कोई आरएसआई मंदी विचलन नहीं है
- शॉर्ट ट्रेडिंग सिग्नल को निम्नलिखित शर्तों को पूरा करना होगा: तेज़ ईएमए धीमी ईएमए से नीचे है, आरएसआई 35 से कम है, और कोई आरएसआई तेजी विचलन नहीं है
रणनीतिक लाभ
- कई तकनीकी संकेतकों के क्रॉस-सत्यापन से ट्रेडिंग सिग्नल की विश्वसनीयता में सुधार होता है
- आरएसआई विचलन का पता लगाकर झूठे ब्रेकआउट के जोखिम को कम करें
- ट्रेंड ट्रैकिंग और ओवरबॉट और ओवरसोल्ड के फायदों को मिलाकर, यह न केवल बड़ी प्रवृत्ति को समझ सकता है, बल्कि अल्पकालिक ट्रेडिंग अवसरों को भी नहीं चूक सकता है।
- मापदंडों को विभिन्न बाजार विशेषताओं के अनुसार अनुकूलित और समायोजित किया जा सकता है
- रणनीति का तर्क स्पष्ट, समझने में आसान और लागू करने में आसान है
रणनीतिक जोखिम
- एक पिछड़े हुए संकेतक के रूप में ईएमए उप-इष्टतम प्रवेश बिंदुओं को जन्म दे सकता है
- अस्थिर बाजार में RSI बहुत अधिक व्यापारिक संकेत उत्पन्न कर सकता है
- विचलन संबंधी निर्णय गलत हो सकता है, विशेष रूप से अत्यधिक अस्थिर बाजारों में
- बाजार में तेजी से बदलाव से बड़ी गिरावट आ सकती है
शमन के उपाय:
- स्टॉप लॉस और टेक प्रॉफिट सेटिंग्स जोड़ी जा सकती हैं
- वॉल्यूम संकेतक सत्यापन जोड़ने पर विचार करें
- अस्थिर बाजार में RSI सीमा को समायोजित करना
रणनीति अनुकूलन दिशा
- बाजार में उतार-चढ़ाव के अनुसार गतिशील रूप से समायोजित करने के लिए अनुकूली आरएसआई थ्रेसहोल्ड का परिचय
- सिग्नल पुष्टिकरण के रूप में वॉल्यूम सूचक जोड़ें
- अधिक सटीक विचलन पहचान एल्गोरिथ्म विकसित करना
- स्टॉप लॉस और लाभ प्रबंधन तंत्र जोड़ें
- बाज़ार में अस्थिरता फ़िल्टर जोड़ने पर विचार करें
संक्षेप
यह रणनीति चलती औसत प्रणाली, गति संकेतक और विचलन विश्लेषण को मिलाकर एक अपेक्षाकृत पूर्ण व्यापार प्रणाली का निर्माण करती है। यह रणनीति संकेतों के बहुविध सत्यापन पर केंद्रित है, जिससे गलत निर्णय के जोखिम को प्रभावी रूप से कम किया जा सके। यद्यपि इसमें कुछ अंतराल है, फिर भी पैरामीटर अनुकूलन और जोखिम प्रबंधन सुधार के माध्यम से इस रणनीति का व्यावहारिक अनुप्रयोग मूल्य अच्छा है।
- 1