
अवलोकन
यह कई तकनीकी संकेतकों और जोखिम प्रबंधन पर आधारित एक प्रवृत्ति ट्रैकिंग रणनीति है। यह रणनीति बाजार की प्रवृत्ति की पहचान करने के लिए कई तकनीकी संकेतकों जैसे कि चलती औसत, अपेक्षाकृत मजबूत संकेतकों (आरएसआई) और गतिशील संकेतकों (डीएमआई) का उपयोग करती है, और गतिशील स्टॉप लॉस, स्थिति प्रबंधन और मासिक अधिकतम निकासी सीमा जैसे जोखिम नियंत्रण साधनों के माध्यम से धन की सुरक्षा करती है। रणनीति का मूल यह है कि प्रवृत्ति की प्रभावशीलता की पुष्टि करने के लिए बहुआयामी तकनीकी संकेतकों का उपयोग किया जाए, जबकि जोखिम को सख्ती से नियंत्रित किया जाए।
रणनीति सिद्धांत
इस रणनीति में कई स्तरों पर प्रवृत्ति की पुष्टि करने के लिए तंत्र का उपयोग किया गया हैः
- 8/21/50 चक्र सूचकांक चलती औसत (ईएमए) के माध्यम से प्रवृत्ति की दिशा का आकलन करें
- प्रवृत्ति फ़िल्टर के रूप में मूल्य चैनल मध्य रेखा का उपयोग करना
- आरएसआई औसत रेखा ((5 चक्र) के संयोजन में 35-65 के बीच के आंदोलनों को फ़िल्टर करने के लिए
- डीएमआई सूचक ((14 चक्र) के माध्यम से प्रवृत्ति की ताकत की पुष्टि
- प्रवृत्ति की निरंतरता को सत्यापित करने के लिए गतिशीलता सूचक ((8 चक्र) और लेनदेन की मात्रा को बढ़ाने का उपयोग करना
- एटीआर-आधारित गतिशील स्टॉप लॉस का उपयोग करके जोखिम को नियंत्रित करना
- एक निश्चित जोखिम मोड के साथ स्थिति प्रबंधन लागू करें, प्रति लेनदेन 5% की प्रारंभिक पूंजी के साथ जोखिम सीमा
- अत्यधिक नुकसान से बचने के लिए 10% की अधिकतम मासिक निकासी सीमा निर्धारित करें
रणनीतिक लाभ
- प्रवृत्ति के आकलन में अधिक सटीकता के लिए बहु-तकनीकी सूचकांक क्रॉस-सत्यापन
- गतिशील स्टॉप लॉस तंत्र एकल लेनदेन जोखिम को प्रभावी ढंग से नियंत्रित करता है
- निश्चित जोखिम के साथ स्थिति प्रबंधन विधि धन का अधिक उचित उपयोग करती है
- मासिक अधिकतम निकासी सीमा प्रणालीगत जोखिम सुरक्षा प्रदान करती है
- संश्लेषित विनिमय सूचकांक, प्रवृत्ति की पुष्टि की विश्वसनीयता को बढ़ाता है
- 2:1 लाभ-हानि अनुपात सेटअप ने दीर्घकालिक लाभप्रदता में सुधार किया
रणनीतिक जोखिम
- कई संकेतकों के उपयोग से संकेत में देरी हो सकती है
- अस्थिर बाजारों में अक्सर झूठे संकेत मिल सकते हैं
- अस्थिरता के साथ फिक्स्ड रिस्क मोड में पर्याप्त लचीलापन नहीं हो सकता है
- मासिक निकासी प्रतिबंधों से महत्वपूर्ण व्यापारिक अवसरों को खोने का खतरा
- प्रवृत्ति में बदलाव के साथ एक बड़ी वापसी की संभावना
रणनीति अनुकूलन दिशा
- विभिन्न बाजार स्थितियों के लिए अनुकूलित सूचकांक मापदंडों की शुरूआत
- बाजार में उतार-चढ़ाव को ध्यान में रखते हुए अधिक लचीले पोजीशन प्रबंधन कार्यक्रम विकसित करना
- प्रवृत्ति की तीव्रता को बढ़ाने के लिए मात्रात्मक मूल्यांकन, प्रवेश के समय को अनुकूलित करना
- एक और स्मार्ट मासिक जोखिम नियंत्रण प्रणाली
- विभिन्न बाजार स्थितियों के लिए रणनीति मापदंडों को समायोजित करने के लिए बाजार परिदृश्य पहचान मॉड्यूल जोड़ें
संक्षेप
रणनीति एक बहुआयामी तकनीकी संकेतकों के एकीकृत उपयोग के माध्यम से एक अपेक्षाकृत पूर्ण प्रवृत्ति ट्रैकिंग ट्रेडिंग प्रणाली का निर्माण करती है। रणनीति की ताकत इसकी व्यापक जोखिम प्रबंधन ढांचे में निहित है, जिसमें गतिशील स्टॉप-लॉस, स्थिति प्रबंधन और वापसी नियंत्रण शामिल हैं। हालांकि कुछ पिछड़े जोखिम हैं, लेकिन अनुकूलन और सुधार के माध्यम से, रणनीति को विभिन्न बाजार स्थितियों में स्थिर प्रदर्शन बनाए रखने की उम्मीद है। कुंजी यह है कि रणनीति के मुख्य तर्क को बनाए रखते हुए, बाजार की स्थिति के लिए अपनी अनुकूलन क्षमता को बढ़ाया जाए।
/*backtest
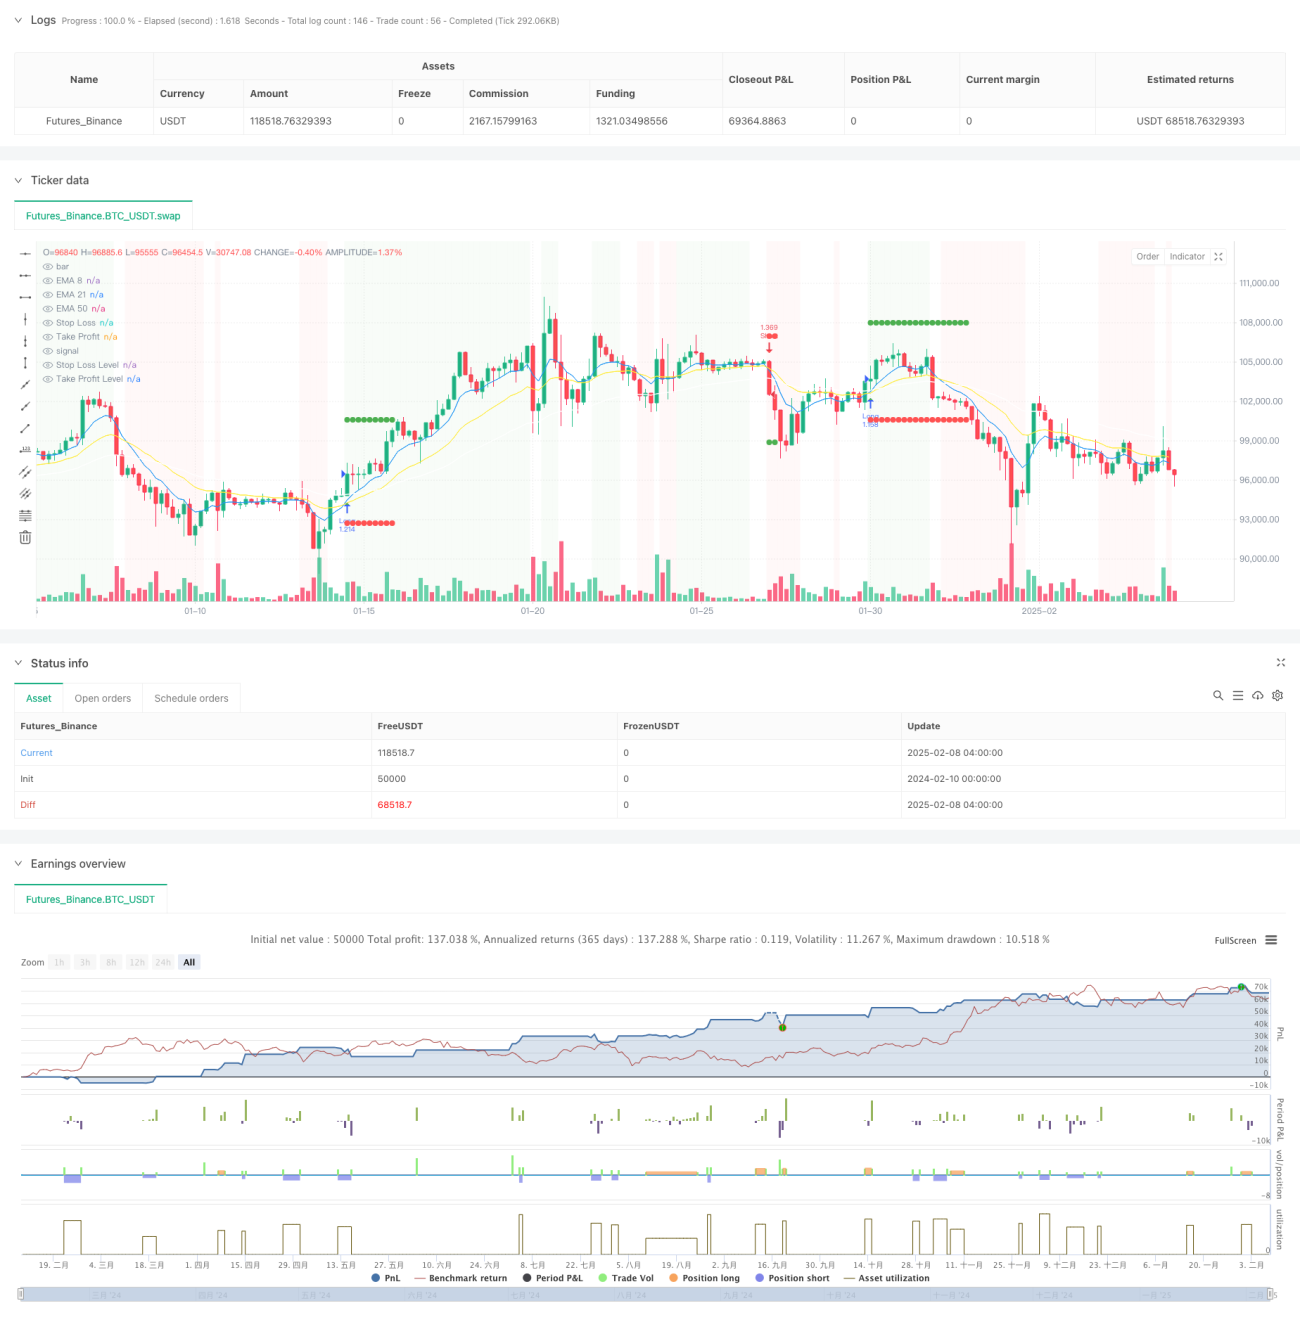
start: 2024-02-10 00:00:00
end: 2025-02-08 08:00:00
period: 4h
basePeriod: 4h
exchanges: [{"eid":"Futures_Binance","currency":"BTC_USDT"}]
*/
//@version=5
strategy("High Win-Rate Crypto Strategy with Drawdown Limit", overlay=true, initial_capital=10000, default_qty_type=strategy.fixed, process_orders_on_close=true)
// Moving Averages- 1