डबल मूविंग एवरेज क्रॉसओवर और स्टोकेस्टिक आरएसआई ओवरबॉट और ओवरसोल्ड रेंज ऑप्टिमाइज़ेशन ट्रेडिंग रणनीति

अवलोकन
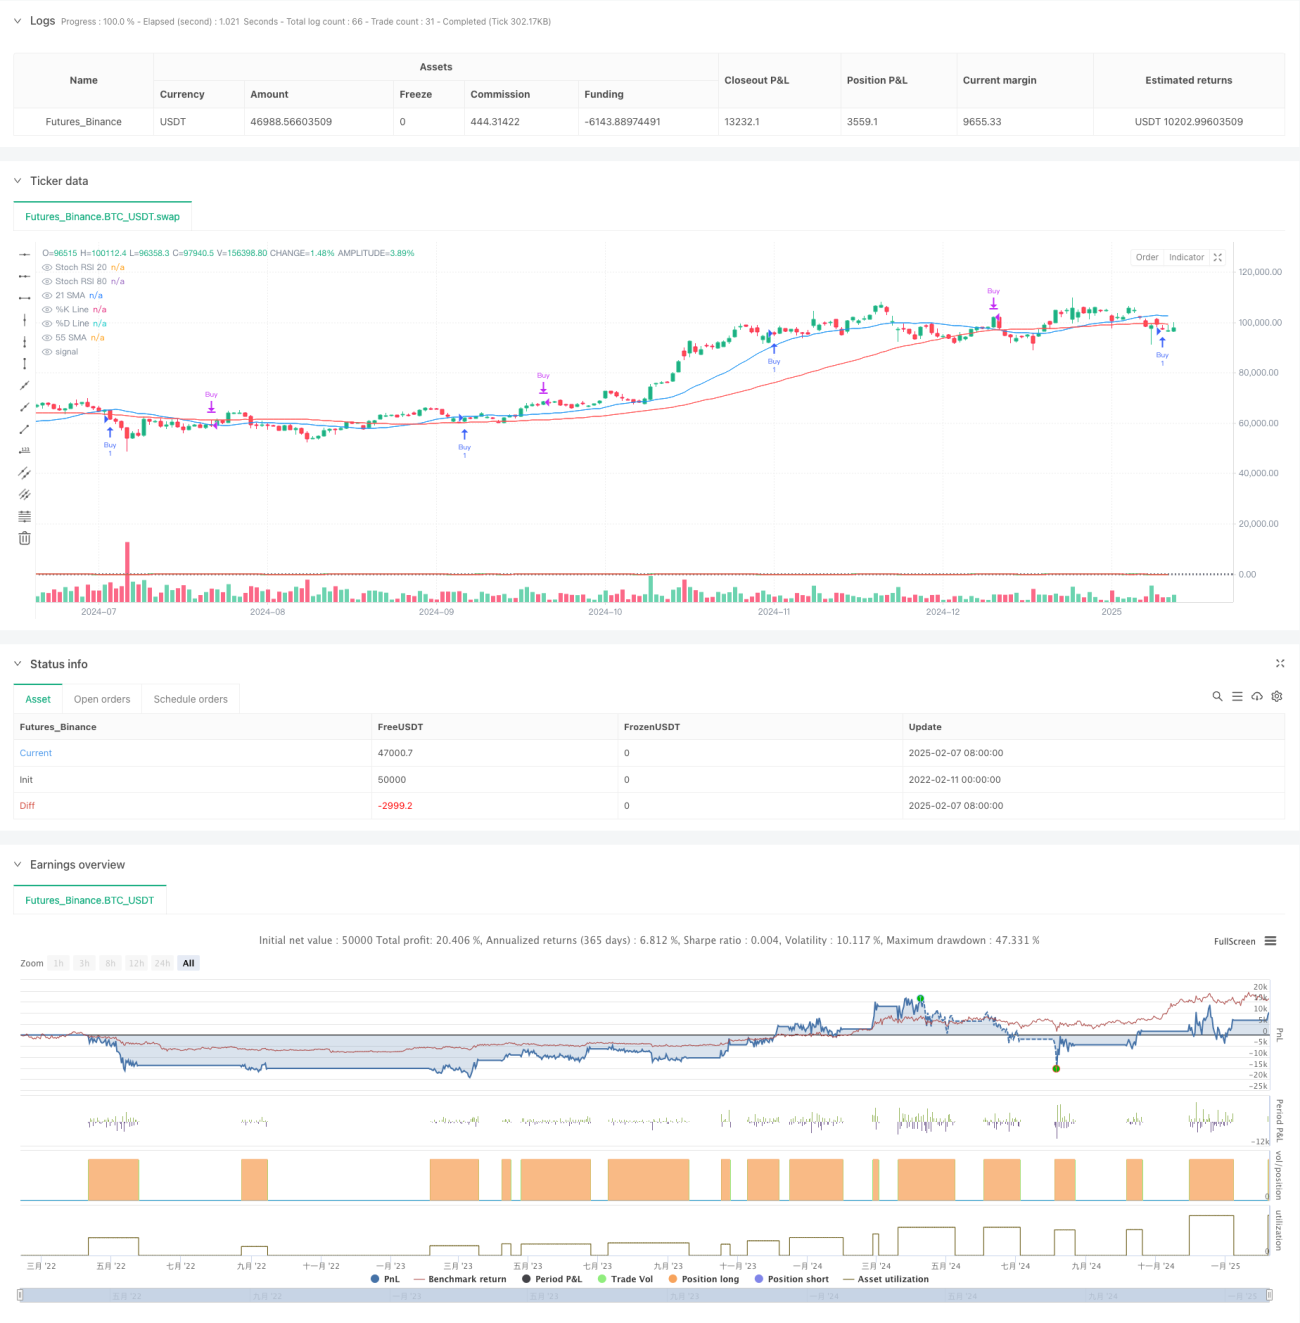
यह रणनीति एक ट्रेडिंग सिस्टम है जिसमें द्विआधारी सममूल्य और यादृच्छिक आरएसआई संकेतक शामिल हैं। यह रणनीति 21 चक्र और 55 चक्र के सरल चलती औसत के माध्यम से बाजार की प्रवृत्ति को निर्धारित करती है, जो कि यादृच्छिक आरएसआई के ओवरबॉय ओवरसोल्ड क्षेत्र का उपयोग करके सबसे अच्छा प्रवेश और निकास बिंदुओं को खोजने के लिए है, जिससे ट्रेंड ट्रेडिंग का अनुकूलन किया जा सके। यह रणनीति एक अपट्रेंड की पुष्टि करने के आधार पर ओवरसोल्ड क्षेत्र में खरीदने के अवसरों की तलाश करती है और ओवरसोल्ड क्षेत्र में बेचने के अवसरों की तलाश करती है।
रणनीति सिद्धांत
इस रणनीति में निम्नलिखित मुख्य तर्क शामिल हैं:
- रुझान की पुष्टिः 21 चक्र SMA और 55 चक्र SMA का उपयोग करके, जब अल्पकालिक औसत रेखा दीर्घकालिक औसत रेखा के ऊपर होती है, तो एक ऊंची प्रवृत्ति की पुष्टि करें।
- प्रवेश सिग्नलः रुझान की पुष्टि के बाद, 20 से नीचे के ओवरसोल्ड क्षेत्र में एक गोल्डन क्रॉस बनाने के लिए यादृच्छिक आरएसआई की K लाइन और D लाइन की प्रतीक्षा करें।
- बाहर निकलें सिग्नल: जब यादृच्छिक आरएसआई की के लाइन 80 से अधिक ओवरबॉय क्षेत्र में डी लाइन के साथ डेड क्रॉसिंग का गठन करती है, तो ब्लीच आउट करें।
- सिग्नल फ़िल्टरिंगः प्रवृत्ति और गतिशीलता संकेतकों के संयोजन के माध्यम से, झूठे संकेतों को प्रभावी ढंग से कम करें।
रणनीतिक लाभ
- बहु-पुष्टि तंत्रः प्रवृत्ति और गतिशीलता की दोहरी पुष्टिकरण के माध्यम से लेनदेन की विश्वसनीयता में वृद्धि।
- जोखिम नियंत्रण का अनुकूलन करेंः ओवरबॉट और ओवरसोल्ड की अवधि का उपयोग करें और प्रवृत्ति की दिशा में बेहतर प्रवेश बिंदु चुनें।
- अनुकूलनीयः रणनीति पैरामीटर को विभिन्न बाजार विशेषताओं के अनुसार समायोजित किया जा सकता है।
- सिग्नल स्पष्टः प्रवेश और निकास की शर्तें स्पष्ट हैं और उन्हें पूरा करना आसान है।
- उच्च स्तर की व्यवस्थितताः रणनीतिक तर्क पूरी तरह से व्यवस्थित है, और व्यक्तिपरक निर्णयों को कम किया गया है।
रणनीतिक जोखिम
- बाजार में उतार-चढ़ाव का जोखिमः बाज़ार में उतार-चढ़ाव के कारण बार-बार लेन-देन हो सकता है।
- विलंबता का जोखिमः एक चलती औसत में विलंबता होती है, जो सबसे अच्छा प्रवेश समय से चूक सकती है।
- झूठे ब्रेकआउट का जोखिमः यादृच्छिक आरएसआई अस्थिर बाजारों में झूठे संकेत दे सकता है।
- पैरामीटर संवेदनशीलता: विभिन्न पैरामीटर संयोजनों के कारण रणनीति प्रदर्शन में बड़े अंतर हो सकते हैं।
रणनीति अनुकूलन दिशा
- अस्थिरता फ़िल्टर जोड़ा गयाः एटीआर सूचकांक की शुरूआत, कम अस्थिरता के दौरान कम व्यापार आवृत्ति।
- ऑप्टिमाइज़ेशन आउटआउट मैकेनिज्म: एक चलती रोक या लाभ लक्ष्य को शामिल करने पर विचार करें।
- बाजार परिवेश वर्गीकरणः विभिन्न बाजार परिवेश की गतिशीलता के अनुसार पैरामीटर को समायोजित करना।
- लेन-देन की पुष्टि में वृद्धिः लेन-देन के संकेतकों को जोड़ना जो संकेत की प्रभावशीलता को सत्यापित करता है।
- प्रवृत्ति की ताकत के संकेतक का परिचयः जैसे कि एडीएक्स, कमजोर प्रवृत्ति वातावरण को फ़िल्टर करने के लिए।
संक्षेप
इस रणनीति में क्लासिक तकनीकी संकेतकों के संयोजन के माध्यम से एक पूर्ण ट्रेंड ट्रैकिंग ट्रेडिंग सिस्टम का निर्माण किया गया है। रणनीति को सरल और सहज बनाए रखते हुए, कई संकेतों की पुष्टि के माध्यम से विश्वसनीयता में वृद्धि की गई है। उचित पैरामीटर अनुकूलन और जोखिम प्रबंधन के माध्यम से, इस रणनीति का अच्छा व्यावहारिक मूल्य है। व्यापारियों को सलाह दी जाती है कि वे वास्तविक उपयोग से पहले पर्याप्त प्रतिक्रिया दें और विशिष्ट बाजार विशेषताओं के अनुसार पैरामीटर को समायोजित करें।
- 1