
अवलोकन
यह रणनीति एक ट्रेडिंग सिस्टम है जो गॉस स्ट्रेन और स्टोच आरएसआई पर आधारित है। यह रणनीति बाजार के रुझानों की पहचान करने के लिए गॉस चैनल का उपयोग करती है और स्टोच आरएसआई के ओवरबॉय ओवरसोल क्षेत्र के साथ जुड़ी हुई है ताकि प्रवेश समय को अनुकूलित किया जा सके। सिस्टम एक बहु-पदार्थ समामेलन विधि का उपयोग करके गॉस चैनल का निर्माण करता है, जो ऊपरी और निचले ट्रैक की गतिशीलता को समायोजित करके मूल्य रुझानों को ट्रैक करता है।
रणनीति सिद्धांत
इस रणनीति के केंद्र में गोस्फेनवे एल्गोरिथ्म पर आधारित मूल्य चैनल है। इसके कार्यान्वयन में निम्नलिखित महत्वपूर्ण कदम शामिल हैंः
- बहुपद फलन f_filt9x का उपयोग करके 9 चरण कास्को फिल्टर को लागू करना, पोल ऑप्टिमाइज़ेशन द्वारा फ़िल्टर प्रभाव को बढ़ाने के लिए
- HLC3 मूल्य के आधार पर गणना की गई मेनफिलर लाइन और अस्थिरता दर चैनल
- Reduced Lag मोड में फ़िल्टर विलंबता को कम करें, FastResponse मोड में प्रतिक्रिया की गति को बढ़ाएं
- स्टोचआरएसआई सूचक का उपयोग करके ओवरबॉट ओवरसोल्ड रेंज ((80/20) व्यापार संकेतों को निर्धारित करने के लिए
- स्टोचआरएसआई के साथ मिलकर एक बहु-संकेत उत्पन्न होता है जब गॉस चैनल ऊपर होता है और कीमतों में वृद्धि होती है
- जब कीमतें पटरी से उतरती हैं, तो बेंच आउट करें
रणनीतिक लाभ
- गॉस्ट्रोन के पास उत्कृष्ट शोर-मुक्ति क्षमता है, जो बाजार के शोर को प्रभावी ढंग से फ़िल्टर कर सकती है
- बहुपद मिलान के माध्यम से प्रवृत्ति को सुचारू रूप से ट्रैक करने और झूठे संकेतों को कम करने के लिए
- विलंबता अनुकूलन और तेजी से प्रतिक्रिया मोड का समर्थन करता है, बाजार विशेषताओं के अनुसार लचीलापन के साथ समायोजित किया जा सकता है
- स्टोच आरएसआई के साथ संयुक्त, प्रवेश के समय को अनुकूलित करने के लिए, व्यापार की सफलता दर में सुधार
- बाजार में उतार-चढ़ाव के लिए गतिशील चैनल चौड़ाई का उपयोग करना
रणनीतिक जोखिम
- गॉस्पेलो में कुछ देरी हो रही है, जो समय पर प्रवेश या बाहर निकलने का कारण बन सकती है
- अस्थिर बाजारों में बार-बार ट्रेडिंग सिग्नल उत्पन्न हो सकते हैं, जिससे ट्रेडिंग की लागत बढ़ सकती है
- StochRSI सूचक कुछ बाजार स्थितियों के तहत एक मंदी संकेत उत्पन्न कर सकता है
- पैरामीटर अनुकूलन प्रक्रिया जटिल है, विभिन्न बाजार स्थितियों के लिए पैरामीटर को फिर से समायोजित करने की आवश्यकता है
- सिस्टम की गणना संसाधनों पर उच्च आवश्यकताएं, वास्तविक समय गणना में कुछ देरी
रणनीति अनुकूलन दिशा
- बाजार की स्थिति के आधार पर गतिशील समायोजन के लिए अनुकूलन पैरामीटर अनुकूलन तंत्र की शुरूआत
- विभिन्न बाजार स्थितियों के लिए विभिन्न पैरामीटर संयोजनों के साथ बाजार परिवेश पहचान मॉड्यूल जोड़ना
- Gaussian Wave Algorithm को अनुकूलित करें और गणना में देरी को और कम करें
- सिग्नल विश्वसनीयता बढ़ाने के लिए अधिक तकनीकी मापदंडों को क्रॉस-वैलिड करें
- स्मार्ट स्टॉप लॉस मैकेनिज्म विकसित करना और जोखिम नियंत्रण क्षमता में सुधार करना
संक्षेप
इस रणनीति के माध्यम से गॉथस की लहर और StochRSI सूचक के संयोजन के माध्यम से बाजार की प्रवृत्तियों के लिए प्रभावी ट्रैकिंग को प्राप्त किया जाता है। प्रणाली में अच्छी शोर क्षमता और प्रवृत्ति की पहचान करने की क्षमता है, लेकिन इसमें कुछ पिछड़ेपन और पैरामीटर अनुकूलन की कठिनाई भी है। निरंतर अनुकूलन और सुधार के माध्यम से, इस रणनीति को वास्तविक व्यापार में स्थिर आय प्राप्त करने की उम्मीद है।
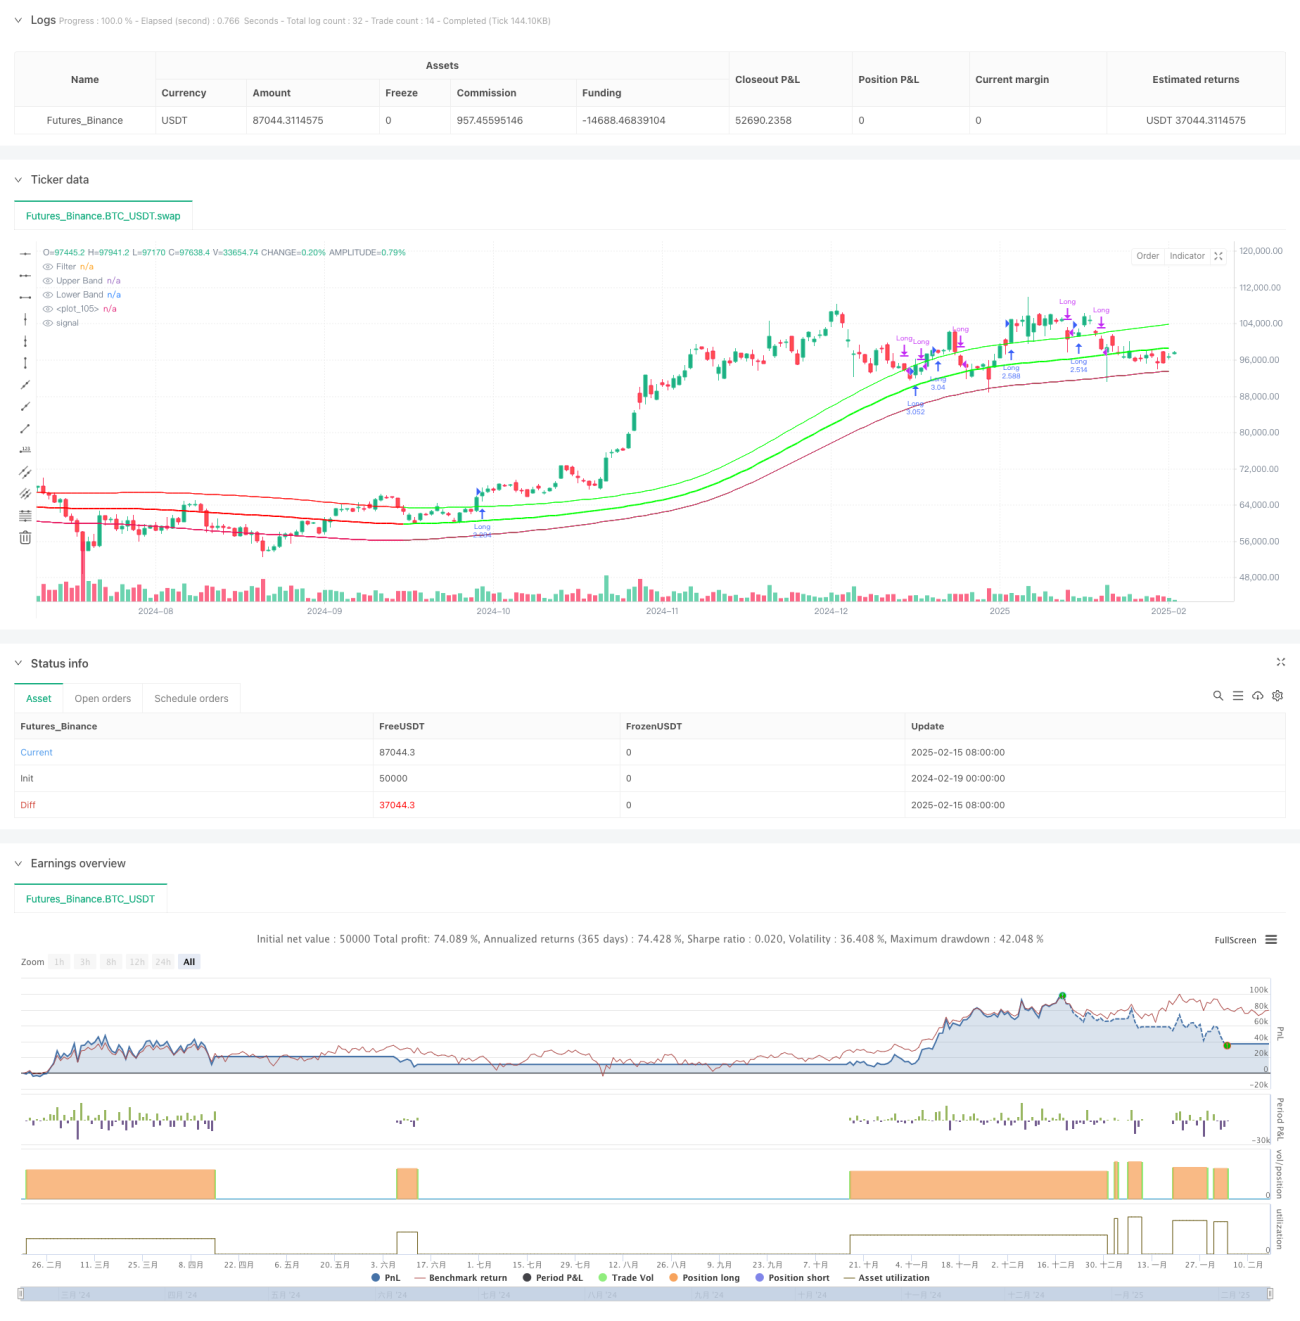
/*backtest
start: 2024-02-19 00:00:00
end: 2025-02-16 08:00:00
period: 1d
basePeriod: 1d
exchanges: [{"eid":"Futures_Binance","currency":"BTC_USDT"}]
*/

//@version=5
strategy(title="Demo GPT - Gaussian Channel Strategy v3.0", overlay=true, commission_type=strategy.commission.percent, commission_value=0.1, slippage=0, default_qty_type=strategy.percent_of_equity, default_qty_value=250)

// ============================================- 1