
अवलोकन
यह रणनीति एक उन्नत रिलेटिव स्ट्रेंथ इंडेक्स (RSI) पर आधारित ट्रेंड फॉलोअर ट्रेडिंग सिस्टम है। यह RSI के संशोधित संस्करण की गणना करके और इसकी सिग्नल लाइन के साथ संयोजन करके विभिन्न बाजार चक्रों में ट्रेंड रिवर्सल के अवसरों को पकड़ता है। यह रणनीति न केवल संकेतक मूल्यों की गणना करती है, बल्कि दृश्य रूप से ओवरबॉट/ओवरसोल्ड क्षेत्रों को प्रदर्शित करती है, जिससे व्यापारी बाजार की स्थिति का अधिक सहजता से आकलन कर सकता है।
रणनीति का सिद्धांत
रणनीति का मुख्य सिद्धांत उन्नत RSI (ARSI) की गणना के माध्यम से बाजार के रुझान की पहचान करना है। इसमें निम्नलिखित शामिल हैं:
- निर्दिष्ट अवधि में उच्चतम और निम्नतम मूल्य की गणना करके मूल्य सीमा प्राप्त करना
- मूल्य परिवर्तन के आधार पर अंतर की गणना करना
- अंतर को स्मूथ करने के लिए वैकल्पिक मूविंग एवरेज विधि (EMA, SMA, RMA, TMA) का उपयोग करना
- परिणाम को 0-100 की सीमा में मानकीकृत करना
- जब ARSI 50 से नीचे सिग्नल लाइन को पार करता है, तो लॉन्ग सिग्नल उत्पन्न होता है
- जब ARSI 50 से ऊपर सिग्नल लाइन को नीचे की ओर तोड़ता है, तो शॉर्ट सिग्नल उत्पन्न होता है
रणनीति के लाभ
- संपूर्ण पुष्टि तंत्र - ARSI और सिग्नल लाइन के क्रॉसओवर और मध्य रेखा फिल्टर सिग्नल की विश्वसनीयता सुनिश्चित करते हैं
- अनुकूलनशीलता - कई मूविंग एवरेज विधियों का समर्थन, बाजार की विशेषताओं के अनुसार समायोजित किया जा सकता है
- उचित जोखिम नियंत्रण - प्रति व्यापार जोखिम को प्रभावी ढंग से नियंत्रित करने के लिए पोजीशन प्रतिशत प्रबंधन का उपयोग
- उत्कृष्ट दृश्य प्रभाव - रंग भरने से ओवरबॉट/ओवरसोल्ड क्षेत्रों को स्पष्ट रूप से प्रदर्शित करता है, त्वरित निर्णय लेने में सहायता
- विपरीत पोजीशन प्रबंधन - विपरीत सिग्नल आने पर स्वचालित रूप से मौजूदा पोजीशन को बंद करता है, द्विपक्षीय होल्डिंग जोखिम से बचता है
रणनीति के जोखिम
- साइडवेज मार्केट जोखिम - समेकन या साइडवेज चाल में बार-बार झूठे सिग्नल उत्पन्न हो सकते हैं
- लैग जोखिम - मूविंग एवरेज की गणना के कारण सिग्नल में कुछ विलंब हो सकता है
- पैरामीटर संवेदनशीलता - विभिन्न पैरामीटर सेटिंग्स के कारण रणनीति का प्रदर्शन काफी भिन्न हो सकता है
- बाजार अनुकूलन जोखिम - रणनीति का प्रदर्शन विभिन्न बाजार परिस्थितियों में काफी भिन्न हो सकता है
- पूंजी प्रबंधन जोखिम - अत्यधिक अस्थिरता के दौरान निश्चित प्रतिशत पोजीशन प्रबंधन बड़ा जोखिम उत्पन्न कर सकता है
रणनीति अनुकूलन दिशाएँ
- अस्थिरता फिल्टर शामिल करना - कम अस्थिरता वाले वातावरण में ट्रेड सिग्नल को फिल्टर करने के लिए ATR संकेतक जोड़ा जा सकता है
- ट्रेंड पुष्टि संकेतक जोड़ना - सिग्नल विश्वसनीयता बढ़ाने के लिए दीर्घ अवधि के ट्रेंड संकेतकों के साथ संयोजन
- पोजीशन प्रबंधन का अनुकूलन - बाजार की अस्थिरता के अनुसार होल्डिंग अनुपात को गतिशील रूप से समायोजित करना
- स्टॉप-लॉस तंत्र जोड़ना - जोखिम को बेहतर ढंग से नियंत्रित करने के लिए ATR-आधारित गतिशील स्टॉप-लॉस सेट करना
- स्व-अनुकूली पैरामीटर विकसित करना - पैरामीटर के गतिशील अनुकूलन विधियों पर शोध करके रणनीति की अनुकूलनशीलता बढ़ाना
सारांश
यह एक संरचनात्मक रूप से पूर्ण और तार्किक रूप से स्पष्ट ट्रेंड फॉलोअर रणनीति है। उन्नत RSI की नवीन गणना पद्धति के माध्यम से, कई तकनीकी संकेतकों के लाभों को मिलाकर, यह एक विश्वसनीय ट्रेडिंग सिस्टम बनाती है। हालाँकि कुछ अंतर्निहित जोखिम हैं, उचित अनुकूलन और जोखिम प्रबंधन उपायों के साथ, इस रणनीति में अच्छी व्यावहारिक अनुप्रयोग संभावनाएँ हैं। सुझाव है कि व्यापारी लाइव ट्रेडिंग में उपयोग करने से पहले पैरामीटर सेटिंग्स का पूरी तरह से परीक्षण करें और बाजार की स्थिति के अनुसार रणनीति कॉन्फ़िगरेशन को समय-समय पर समायोजित करें।
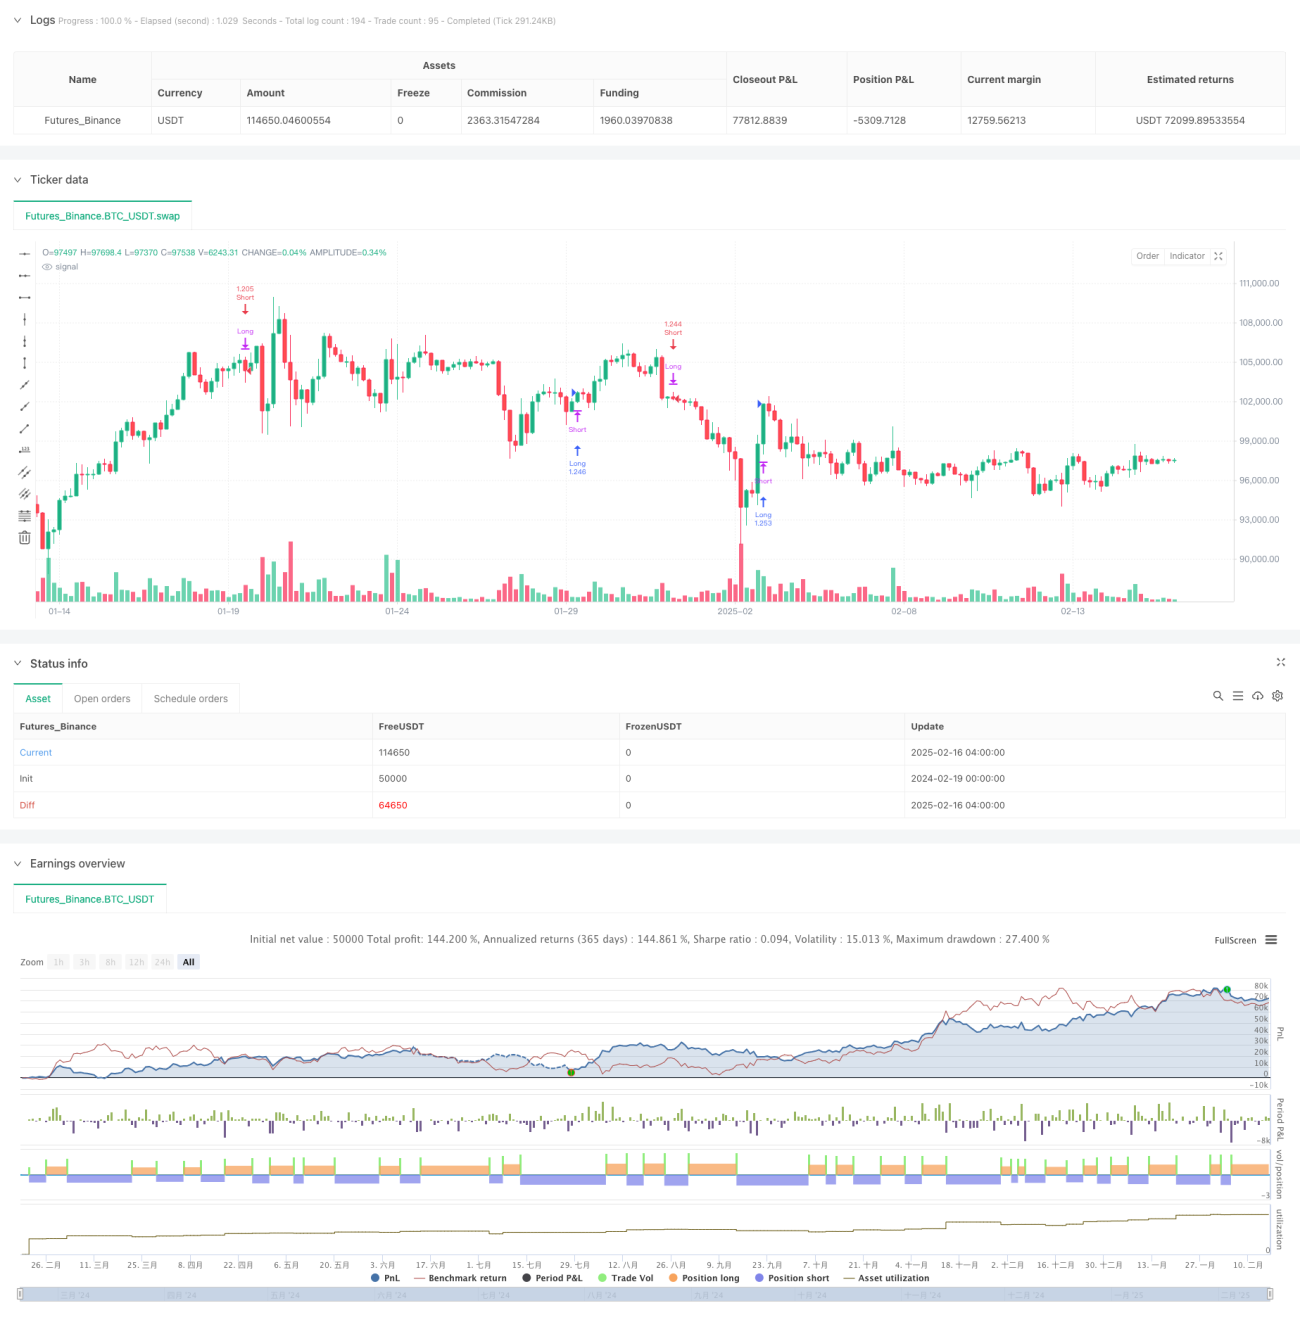
/*backtest
start: 2024-02-19 00:00:00
end: 2025-02-16 08:00:00
period: 4h
basePeriod: 4h
exchanges: [{"eid":"Futures_Binance","currency":"BTC_USDT"}]
*/

//@version=6
strategy("Ultimate RSI [LuxAlgo] Strategy", shorttitle="ULT RSI Strat", overlay=false, initial_capital=10000, currency=currency.USD, default_qty_type=strategy.percent_of_equity, default_qty_value=100)

//------------------------------------------------------------------------------- 1