बहु-अवधि चलती औसत प्रवृत्ति निर्णय और आरएसआई ओवरबॉट रणनीति

अवलोकन
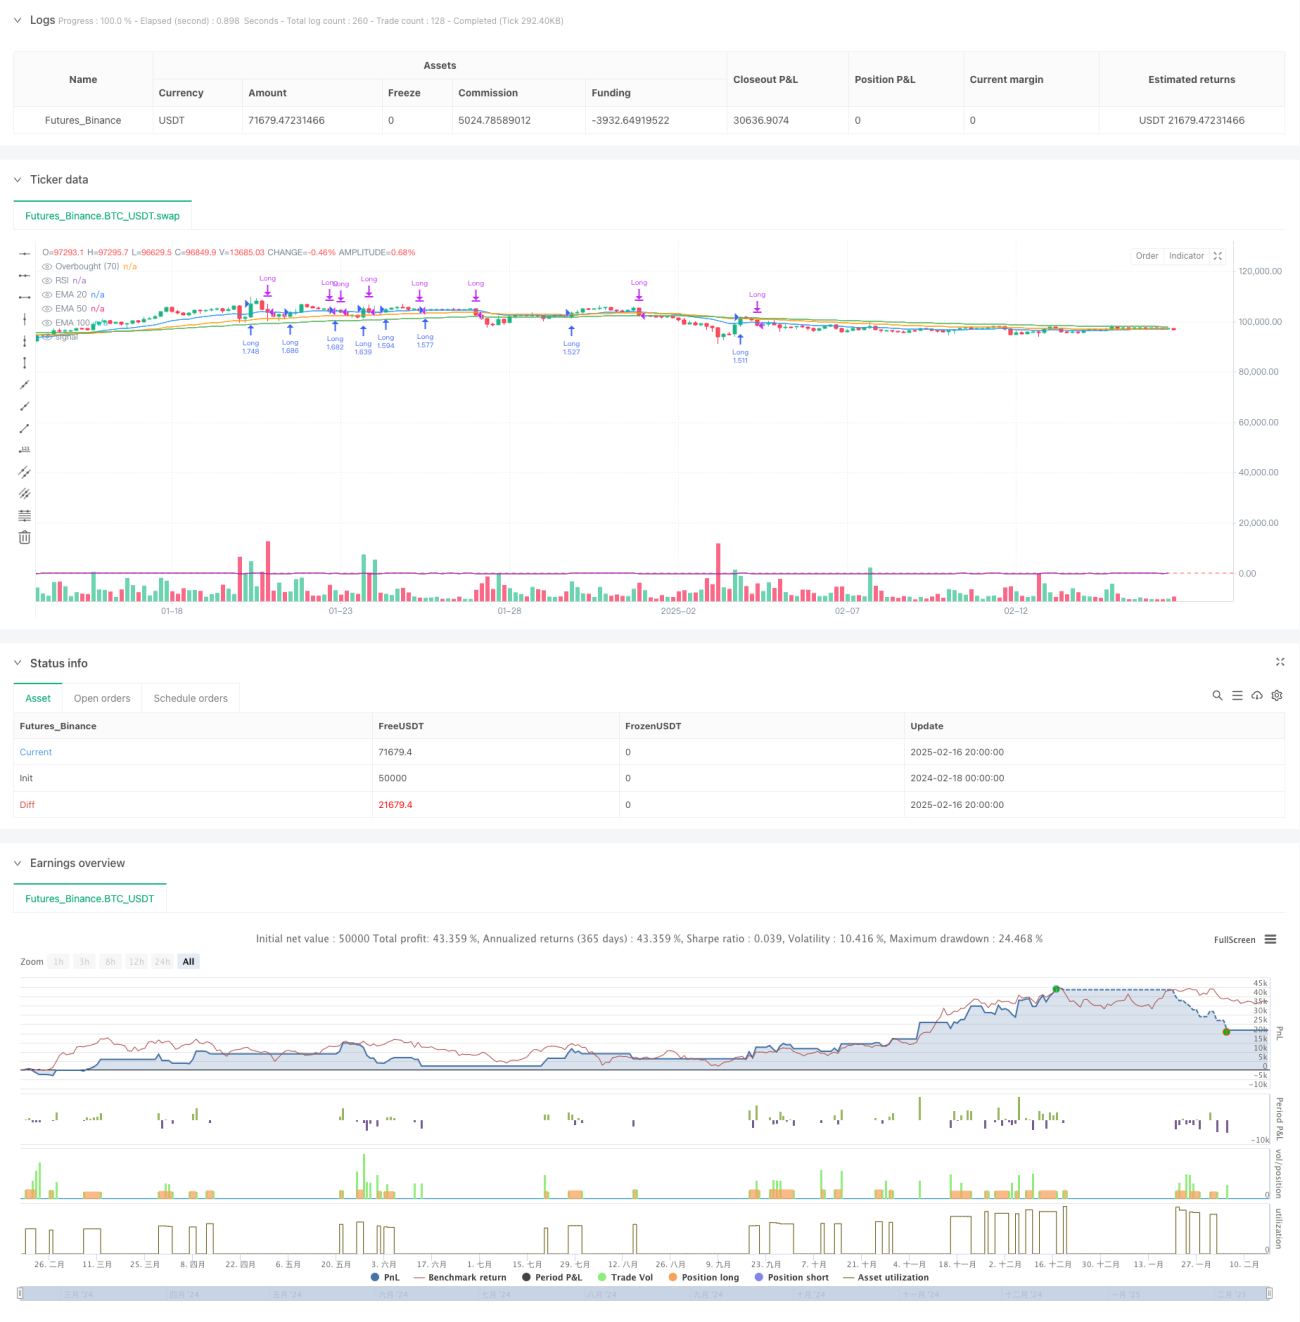
यह रणनीति एक ट्रेडिंग सिस्टम है जो एक बहु-आयामी सूचकांक चलती औसत (ईएमए) और एक अपेक्षाकृत मजबूत सूचक (आरएसआई) पर आधारित है। यह रणनीति ट्रेडिंग निर्णय लेने के लिए 20, 50, 100 तीन-आयामी ईएमए रुझानों का आकलन करती है, जो मूल्य ब्रेकआउट और आरएसआई ओवरबॉय सिग्नल के साथ संयुक्त होती है। यह रणनीति मुख्य रूप से ट्रेंडिंग मार्केट के लिए है, जो कई तकनीकी संकेतकों के सत्यापन के माध्यम से ट्रेडिंग की सटीकता में सुधार करती है।
रणनीति सिद्धांत
रणनीति के मूल तर्क में निम्नलिखित प्रमुख भाग शामिल हैं:
- प्रवृत्ति का निर्णयः यह निर्धारित करने के लिए कि क्या तीन चक्रों की औसत रेखाएं (20/50/100) वर्तमान और पिछले चक्रों के ईएमए की तुलना में एक ऊपर की ओर प्रवृत्ति में हैं
- प्रवेश की शर्तेंः जब कीमत नीचे से 20 चक्र ईएमए को तोड़ती है और तीनों समानांतर ऊपर की ओर होते हैं, तो एक खरीद संकेत देता है
- बाहर निकलने की शर्तेंः जब आरएसआई 70 से अधिक हो (ओवरबॉय) या जब कीमत 20 चक्र ईएमए से नीचे गिर जाए तो बेंचमार्क
- पोजीशन मैनेजमेंटः खाते की कुल वैल्यू का प्रतिशत (१०%) पोजीशन के लिए
रणनीतिक लाभ
- बहु-पुष्टिकरण तंत्रः तीन अलग-अलग चक्रों के ईएमए और आरएसआई सूचकांकों के माध्यम से एक-दूसरे को सत्यापित करने के लिए, झूठे ब्रेक के जोखिम को कम करना
- ट्रेंड ट्रैकिंगः मध्यम और दीर्घकालिक रुझानों को प्रभावी ढंग से पकड़ने और लाभप्रदता में सुधार करने के लिए
- जोखिम नियंत्रणः आरएसआई ओवरबॉय सिग्नल और औसत रेखा के टूटने का उपयोग रोक के रूप में करें, प्रभावी रूप से वापसी को नियंत्रित करें
- फंड मैनेजमेंटः प्रतिशत पोजीशन मैनेजमेंट के साथ, ट्रेडिंग वॉल्यूम को खाते के आकार के आधार पर स्वचालित रूप से समायोजित किया जा सकता है
- व्यवस्थित संचालनः रणनीतिक नियम स्पष्ट हैं, जो व्यक्तिपरक निर्णयों से होने वाली गड़बड़ी को कम करते हैं
रणनीतिक जोखिम
- विलंबताः ईएमए के रूप में विलंबता के कारण प्रवेश और प्रस्थान में थोड़ी देरी हो सकती है
- बाजार में उतार-चढ़ाव का जोखिमः बाज़ार में उतार-चढ़ाव के दौरान अक्सर झूठे संकेत मिल सकते हैं
- जोखिमः बाजार में भारी उतार-चढ़ाव के कारण स्टॉपलॉस की स्थिति खराब हो सकती है
- पैरामीटर संवेदनशीलताः विभिन्न बाजार स्थितियों में ईएमए चक्र और आरएसआई थ्रेशोल्ड को समायोजित करने की आवश्यकता हो सकती है
- लेन-देन की लागतः बार-बार लेन-देन करने से लेन-देन की अधिक लागत हो सकती है
रणनीति अनुकूलन दिशा
- बाजार की स्थिति की पहचानः बाजार की स्थिति का आकलन करने के लिए एक तंत्र जोड़ा गया है, जो बाजार में उतार-चढ़ाव के दौरान स्वचालित रूप से स्थिति को कम करता है या व्यापार को निलंबित करता है
- गतिशील पैरामीटर अनुकूलनः बाजार में उतार-चढ़ाव के आधार पर स्वचालित रूप से ईएमए चक्र और आरएसआई थ्रेशोल्ड को समायोजित करता है
- स्टॉप लॉस ऑप्टिमाइज़ेशनः ट्रैक स्टॉप लॉस मैकेनिज्म की शुरूआत, मुनाफे की बेहतर सुरक्षा
- प्रवेश अनुकूलनः वृद्धि की मात्रा की पुष्टि के लिए तंत्र, तोड़ने के संकेत की विश्वसनीयता में सुधार
- स्थिति प्रबंधन का अनुकूलनः प्रवृत्ति की ताकत और बाजार में उतार-चढ़ाव की गतिशीलता के आधार पर स्थिति अनुपात को समायोजित करना
संक्षेप
यह एक जटिल रणनीति प्रणाली है जिसमें प्रवृत्ति अनुवर्ती और गतिशीलता उलट है। रणनीति को सरल और समझने में आसान रखते हुए, कई तकनीकी संकेतकों के संयोजन के उपयोग के माध्यम से, बेहतर जोखिम-लाभ विशेषताएं प्राप्त की जाती हैं। रणनीति का मुख्य लाभ इसकी सख्त प्रवृत्ति की पुष्टि करने वाली तंत्र और एक पूरी तरह से विकसित जोखिम नियंत्रण प्रणाली में है, लेकिन वास्तविक अनुप्रयोगों में पैरामीटर अनुकूलन और बाजार की स्थिति के अनुकूलता पर ध्यान देने की आवश्यकता है।
/*backtest
start: 2024-02-18 00:00:00
end: 2025-02-17 00:00:00
period: 4h
basePeriod: 4h
exchanges: [{"eid":"Futures_Binance","currency":"BTC_USDT"}]
*/

//@version=5
strategy("EMA Crossover + RSI Strategy", overlay=true, initial_capital=10000, default_qty_type=strategy.percent_of_equity, default_qty_value=200)

// Calculate EMAs- 1