बहु-संकेतक प्रवृत्ति ट्रैकिंग उन्नत मात्रात्मक व्यापार रणनीति

अवलोकन
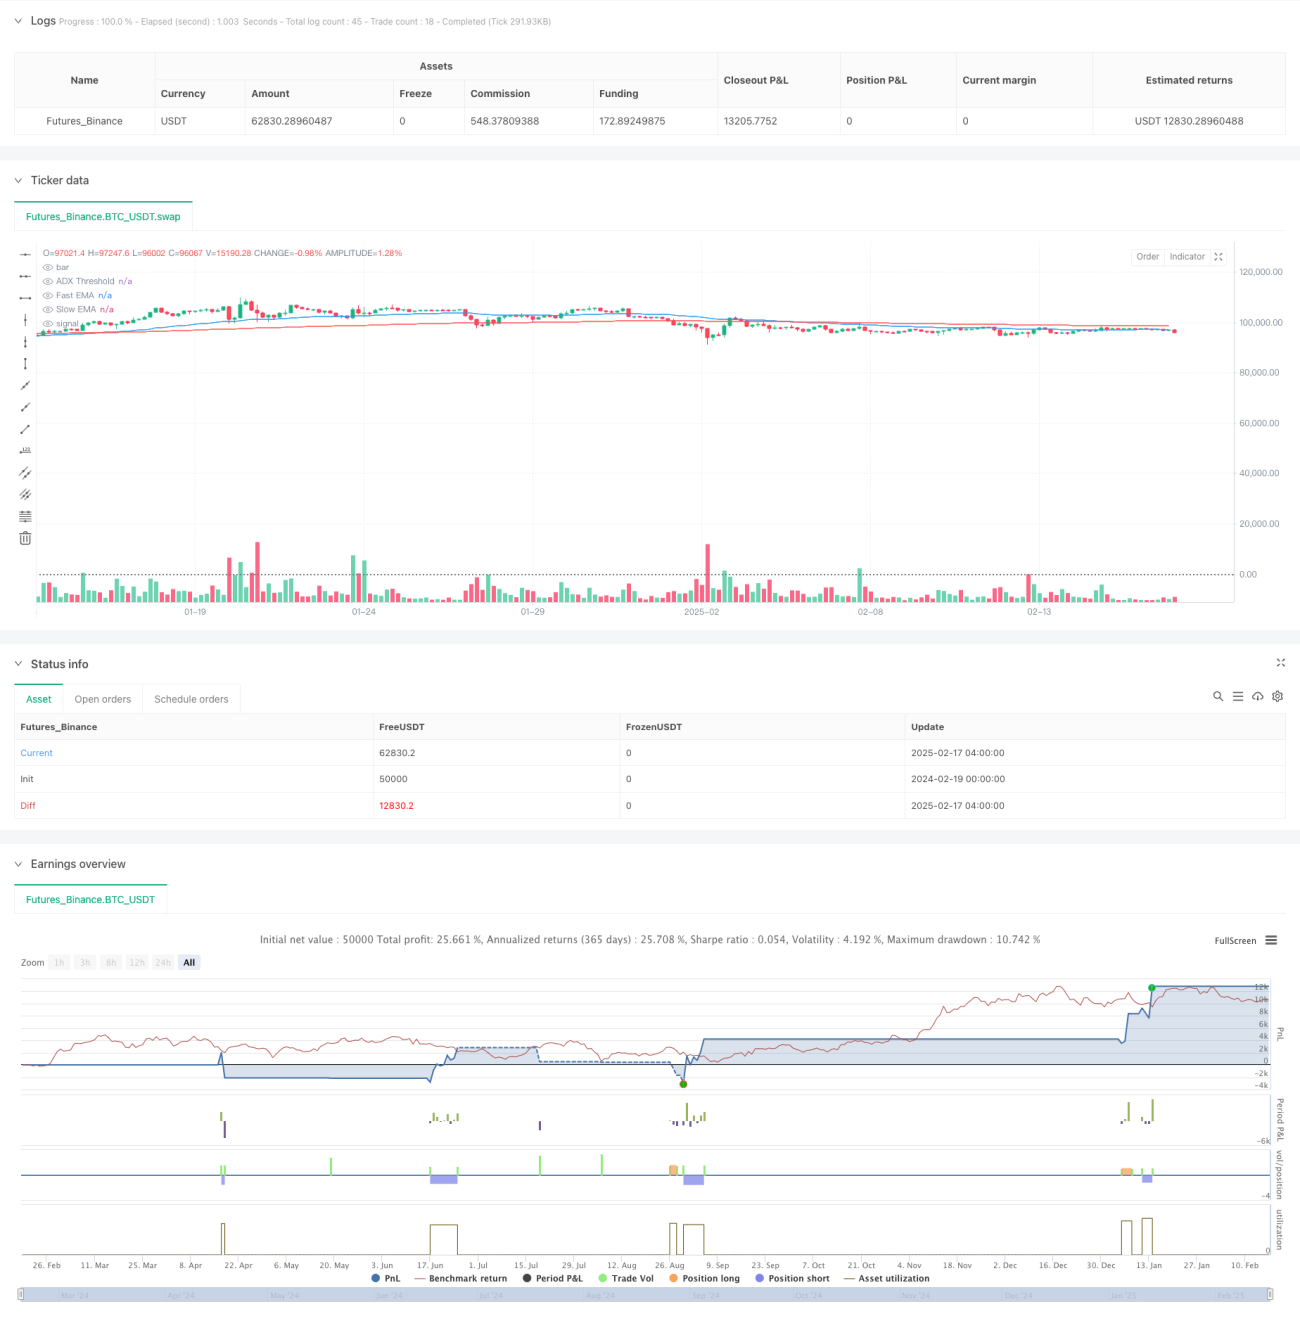
यह रणनीति एक बहु-तकनीकी सूचक-आधारित ट्रेंड ट्रैकिंग रणनीति है, जिसमें कई तकनीकी सूचकांकों जैसे कि चलती औसत (EMA), औसत ट्रेंड सूचक (ADX) और अपेक्षाकृत मजबूत सूचक (RSI) को एकीकृत किया गया है, और बहु-समय-फ्रेम विश्लेषण विधियों को जोड़ा गया है। रणनीति मुख्य रूप से तेजी से और धीमी गति से ईएमए के क्रॉसिंग के माध्यम से प्रवृत्ति की दिशा की पुष्टि करती है। रणनीति का उपयोग प्रवृत्ति की ताकत को फ़िल्टर करने के लिए एडीएक्स का उपयोग करती है, आरएसआई के माध्यम से बाजार की गतिशीलता का आकलन करने के लिए, जिससे 1 मिनट के चार्ट पर उच्च आवृत्ति व्यापार किया जा सकता है। समीक्षा परिणामों से पता चलता है कि रणनीति में 76.92% की जीत की दर और 1.819 के लाभप्रदता कारक हैं, जो अच्छी लाभप्रदता का प्रदर्शन करते हैं।
रणनीति सिद्धांत
रणनीति निम्नलिखित मुख्य तंत्रों पर आधारित हैः
- प्रवृत्ति की दिशा को पहचानने के लिए 50 चक्र और 200 चक्र ईएमए का उपयोग करें, और प्रवेश संकेतों को तेज और धीमी रेखा के क्रॉसिंग द्वारा पुष्टि करें
- ADX सूचकांक ((14 चक्र) का उपयोग करके प्रवृत्ति की ताकत का आकलन करें, केवल ADX 25 से अधिक होने पर प्रवेश करें, बाजार के झटके से बचें
- आरएसआई संकेतक ((14 चक्र) के साथ संयोजन में गतिशीलता विश्लेषण, आरएसआई 30 से कम होने पर अधिक करने पर विचार करें, 70 से अधिक होने पर कम करने पर विचार करें
- 4-घंटे की समय सीमा पर ईएमए विश्लेषण की शुरूआत, बहु-समय सीमा की पुष्टि के माध्यम से प्रवृत्ति निर्णय की विश्वसनीयता को बढ़ाने के लिए
- गतिशील स्टॉप लॉस सेट करें, स्टॉप लॉस को 5% की शुरुआती कीमत पर और स्टॉप लॉस को 2% पर सेट करें; वैकल्पिक रूप से वैकल्पिक रूप से करें
रणनीतिक लाभ
- बहु-सूचक क्रॉस-सत्यापन, सिग्नल विश्वसनीयता में उल्लेखनीय वृद्धि
- गतिशील स्टॉपओवर और अस्थिरता-आधारित पोजीशन प्रबंधन सहित एक मजबूत जोखिम नियंत्रण तंत्र
- मल्टी-टाइम-फ्रेम एनालिसिस का उपयोग करके, झूठी घुसपैठ के जोखिम को कम करें
- उच्च जीत दर और मध्यम लाभ हानि अनुपात, अच्छी उम्मीद के साथ लाभ
- रणनीति का तर्क स्पष्ट, समझने में आसान और बनाए रखने में आसान है
रणनीतिक जोखिम
- बाजार में तेजी से उतार-चढ़ाव के कारण स्टॉप लॉस का प्रभाव कम हो सकता है
- बाज़ारों में उतार-चढ़ाव से लेन-देन की लागत बढ़ सकती है
- ईएमए सूचकांक अपने आप में पिछड़ा हुआ है और सबसे अच्छा प्रवेश समय से चूक सकता है
- कई सूचकांक परस्पर विरोधी संकेत दे सकते हैं
- 1 मिनट की अवधि के लेन-देन में निष्पादन की गति की उच्च आवश्यकता होती है और स्लिप पॉइंट जोखिम हो सकता है
रणनीति अनुकूलन दिशा
- ADX smoothing पैरामीटर को अनुकूलित करें और प्रवृत्ति पहचान की सटीकता में सुधार करें
- एटीआर-आधारित गतिशील पोजीशन प्रबंधन की शुरूआत, बाजार में उतार-चढ़ाव के लिए बेहतर अनुकूलन
- वॉल्यूम विश्लेषण के आयाम को बढ़ाएं और सिग्नल विश्वसनीयता में सुधार करें
- विभिन्न बाजार स्थितियों के लिए अलग-अलग पैरामीटर के संयोजन का उपयोग करके बाजार परिवेश वर्गीकरण जोड़ने पर विचार करें
- हम मशीन लर्निंग एल्गोरिदम को एकीकृत करने का प्रयास कर सकते हैं, पैरामीटर के चयन को अनुकूलित कर सकते हैं
संक्षेप
इस रणनीति में कई तकनीकी संकेतकों के साथ समन्वय के माध्यम से एक मजबूत प्रवृत्ति ट्रैकिंग प्रणाली का निर्माण किया गया है। इस रणनीति ने उच्च जीत दर बनाए रखने के साथ-साथ एक अच्छी तरह से विकसित जोखिम नियंत्रण तंत्र के माध्यम से काफी लाभ प्राप्त किया है। हालांकि कुछ अनुकूलन के लिए जगह है, समग्र प्रदर्शन संतोषजनक है, विशेष रूप से उन व्यापारियों के लिए उपयुक्त है जो स्थिर लाभ की तलाश में हैं।
/*backtest
start: 2024-02-19 00:00:00
end: 2025-02-17 08:00:00
period: 4h
basePeriod: 4h
exchanges: [{"eid":"Futures_Binance","currency":"BTC_USDT"}]
*/

//@version=5
strategy("Enhanced Trend Following Strategy", overlay=true, default_qty_type=strategy.percent_of_equity, default_qty_value=200)

// === INPUTS ===- 1