अवलोकन
यह रणनीति एक प्रवृत्ति ट्रैकिंग ट्रेडिंग प्रणाली है जिसमें कई तकनीकी संकेतक शामिल हैं। यह मुख्य रूप से सरल चलती औसत (एसएमए) और सूचकांक चलती औसत (ईएमए) के क्रॉस सिग्नल पर आधारित है, और इसमें कई उन्नत विशेषताएं शामिल हैं जैसे कि हॉल की चलती औसत (एचएमए) ट्रेंड बैंड, विलियम सूचक (% आर), और उच्च और निम्न बिंदु विश्लेषण को गतिशील फ़िल्टरिंग तंत्र के माध्यम से अधिक विश्वसनीय ट्रेडिंग सिग्नल प्रदान करने के लिए।
रणनीति सिद्धांत
इस रणनीति का मूल तर्क निम्नलिखित प्रमुख तत्वों पर आधारित हैः
- 100 चक्र के SMA और 200 चक्र के EMA को मुख्य प्रवृत्ति निर्धारकों के रूप में उपयोग करें
- 70 चक्रों के एकीकृत एचएमए ट्रेंड बैंड का उपयोग ट्रेंड की गतिशीलता की पुष्टि करने के लिए किया जाता है
- विलियम सूचक ((%R) का उपयोग करके गतिशील समर्थन / प्रतिरोध बिट्स की गणना करें
- 20 चक्रों के लिए एक रिवर्स विंडो के माध्यम से उच्च और निम्न स्तर का पता लगाएं
- वास्तविक समय की निगरानी और अद्यतन
- झूठे संकेतों को कम करने के लिए स्टार्ट-अप फ़िल्टर और अस्थिरता थ्रेशोल्ड ((0.5%) सेट करें
प्रवेश की शर्तों को एक साथ पूरा करना होगा: मूल्य स्टेशन पर दोहरी औसत रेखा,% R सूचक लगातार 3 K लाइनों में बढ़ता है और 20 से अधिक है, K लाइन बंद होती है और समापन मूल्य पहले की तुलना में अधिक होता है, कीमत दिन के भीतर उतार-चढ़ाव की सीमा से अधिक नहीं होती है। निम्नलिखित में से किसी एक को पूरा करने के लिए बाहर निकलेंः कीमत दोहरी औसत रेखा से नीचे है; %R सूचक -80 से नीचे है।
रणनीतिक लाभ
- बहु-तकनीकी सूचकांकों के सह-प्रमाणन से ट्रेडिंग सिग्नल की विश्वसनीयता बढ़ी
- गतिशील फ़िल्टरिंग तंत्र ने अत्यधिक उतार-चढ़ाव के दौरान झूठे संकेतों को प्रभावी रूप से कम किया
- स्व-अनुकूली समर्थन प्रतिरोध की गणना रणनीति को अच्छी बाजार अनुकूलन क्षमता प्रदान करती है
- पूर्ण इन-डे ट्रेडिंग प्रबंधन तंत्र, जिसमें शुरुआती फ़िल्टरिंग और अस्थिरता थ्रेशोल्ड नियंत्रण शामिल है
- विभिन्न बाजार स्थितियों के अनुसार अनुकूलन के लिए पैरामीटर समायोज्य हैं
रणनीतिक जोखिम
- एक समान रेखा प्रणाली अक्सर झूठे संकेतों का उत्पादन कर सकती है जब बाजार में उतार-चढ़ाव होता है
- कई शर्तों के साथ फ़िल्टरिंग के कारण कुछ संभावित व्यापारिक अवसरों से वंचित रह सकते हैं
- एक निश्चित चलती औसत का चक्र विभिन्न बाजार स्थितियों में भिन्न हो सकता है
- इन-डे ट्रेडिंग फ़िल्टरिंग तंत्र तेजी से बढ़ते रुझानों के बीच महत्वपूर्ण अवसरों को खो सकता है
- पैरामीटर के अति-अनुकूलन से ओवरफिटिंग समस्या हो सकती है
रणनीति अनुकूलन दिशा
- अनुकूलन योग्य सम-रेखीय चक्र गणना तंत्र की शुरूआत, ताकि सिस्टम बाजार में उतार-चढ़ाव के लिए बेहतर रूप से अनुकूल हो सके
- ट्रेंड की पुष्टि की विश्वसनीयता बढ़ाने के लिए लेनदेन विश्लेषण के लिए मापदंडों में वृद्धि
- गतिशील रोकथाम तंत्र विकसित करना और धन प्रबंधन की दक्षता में सुधार करना
- फ़िल्टरिंग स्थितियों को अनुकूलित करने के लिए बाजार में उतार-चढ़ाव के संकेतकों को जोड़ने के लिए थ्रेशोल्ड सेटिंग
- विभिन्न समय चक्रों में सिग्नल समन्वय को ध्यान में रखते हुए, सिस्टम की स्थिरता को बढ़ाएं
संक्षेप
यह एक अच्छी तरह से डिज़ाइन की गई प्रवृत्ति ट्रैकिंग ट्रेडिंग प्रणाली है, जो विश्वसनीयता की गारंटी देते हुए कई तकनीकी संकेतकों के संयोजन और सख्त फ़िल्टरिंग तंत्र के माध्यम से एक अच्छी लचीलापन बनाए रखती है। रणनीति के अनुकूलन के लिए जगह मुख्य रूप से पैरामीटर की आत्म-अनुकूलन और जोखिम प्रबंधन तंत्र के सुधार में है। व्यापारियों को सलाह दी जाती है कि वे वास्तविक बाजार में उपयोग करने से पहले विभिन्न बाजार स्थितियों में प्रदर्शन का परीक्षण करें और पैरामीटर सेटिंग्स को विशिष्ट परिस्थितियों के अनुसार समायोजित करें।
/*backtest
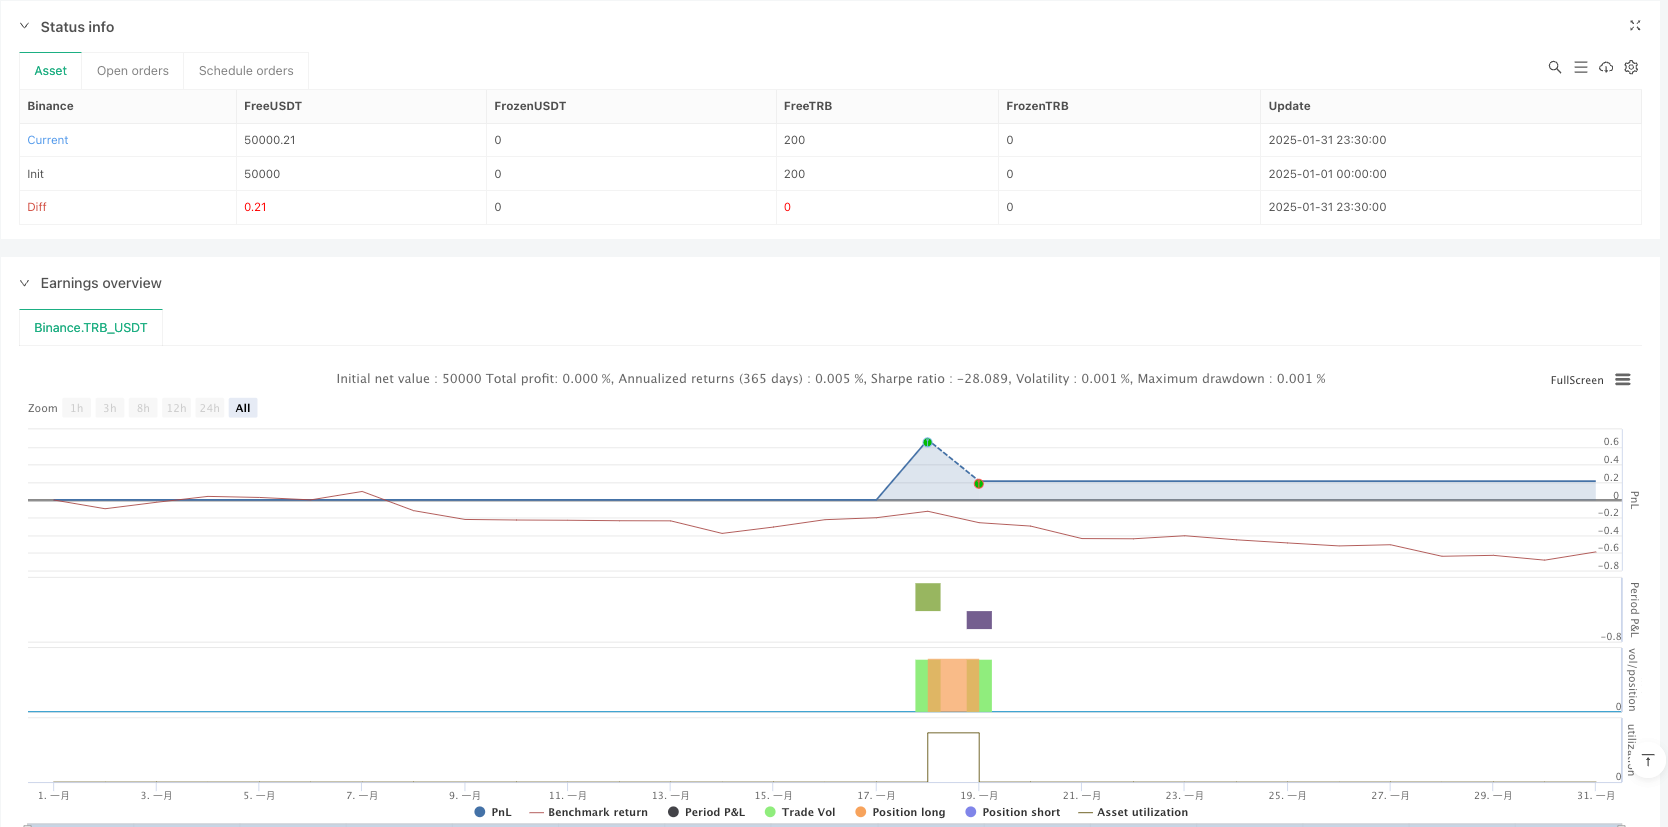
start: 2025-01-01 00:00:00
end: 2025-01-31 23:59:59
period: 30m
basePeriod: 30m
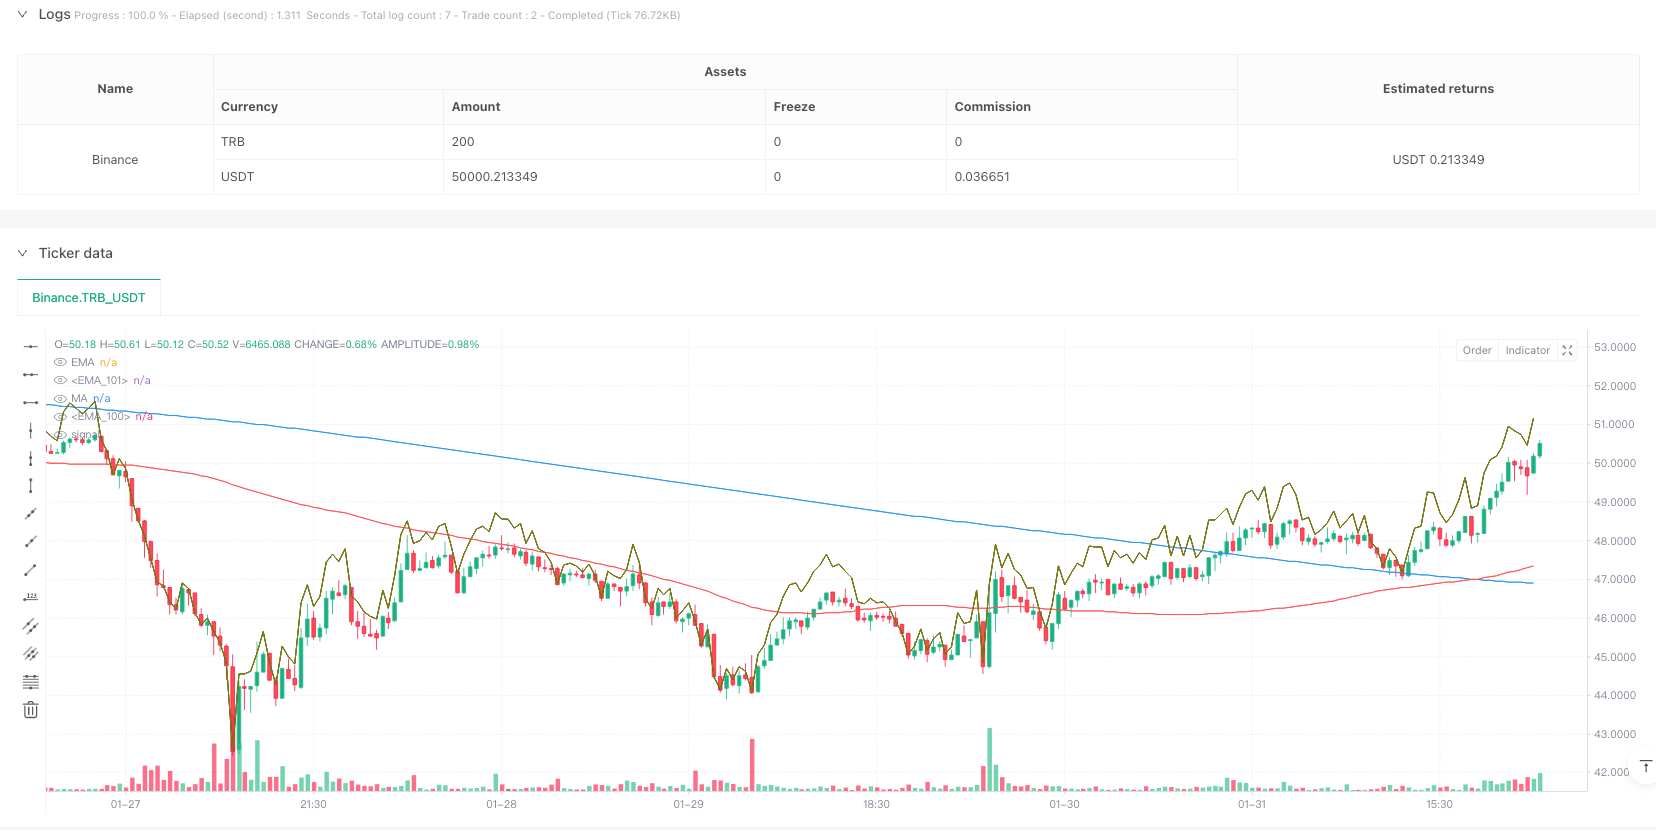
exchanges: [{"eid":"Binance","currency":"TRB_USDT"}]
*/
//@version=5
strategy(title="EMA & MA Crossover Strategy", shorttitle="EMA & MA Crossover Strategy", overlay=true)
// Inputs
LengthMA = input.int(100, minval=1, title="MA Length")
LengthEMA = input.int(200, minval=1, title="EMA Length")
swingLookback = input.int(20, title="Swing Lookback")
Lengthhmaribbon = input.int(70, minval=1, title="HMA Ribbon")
// Input for ignoring the first `n` candles of the day
ignore_n_candles = input.int(1, "Ignore First N Candles", minval=0)
// Input for percentage threshold to ignore high run-up candles
run_up_threshold = input.float(0.5, "Run-up Threshold (%)", minval=0.0)
//====================================================================
hmacondition = ta.hma(close,Lengthhmaribbon)> ta.hma(close,Lengthhmaribbon)[1]
//====================================================================
// Function to drop the first `n` candles
dropn(src, n) =>
na(src[n]) ? na : src
// Request data with the first `n` candles dropped
valid_candle = not na(dropn(close, ignore_n_candles))
// Check for run-up condition on the previous candle
prev_run_up = (high[1] - low[1]) / low[1] * 100
// Combine conditions: exclude invalid candles and ignore high run-up candles
valid_entry_condition = valid_candle and prev_run_up <= run_up_threshold
//======================================================
// Define the start of a new day based on time
var is_first = false
var float day_high = na
var float day_low = na
// Use time() to detect the start of a new day
t = time("1440") // 1440 = 60 * 24 (one full day in minutes)
is_first := na(t[1]) and not na(t) or t[1] < t
if is_first and barstate.isnew
day_high := high
day_low := low
else
day_high := nz(day_high[1], high)
day_low := nz(day_low[1], low)
// Update daily high and low
if high > day_high
day_high := high
if low < day_low
day_low := low
//====================================================
previousdayclose = request.security(syminfo.tickerid, "D", close)
day_highrange = previousdayclose*.018
//======================================================
length = input(title="Length", defval=14)
src = input(close, "Source")
_pr(length) =>
max = ta.highest(length)
min = ta.lowest(length)
100 * (src - max) / (max - min)
percentR = _pr(length)
//======================================================
higherline = close* 1+((100-(percentR*-1))/100)
lowerline = close* 1-((100-(percentR*-1))/100)
//======================================================
// Moving Averages
xMA = ta.sma(close, LengthMA)
xEMA = ta.sma(xMA, LengthEMA)
// Plot the MA and EMA lines
plot(xMA, color=color.red, title="MA")
plot(xEMA, color=color.blue, title="EMA")
// Find recent swing high and low
recentHigh = ta.highest(high, swingLookback)
recentLow = ta.lowest(low, swingLookback)
//===============================================
emacondition = ta.ema(close,20)>ta.ema(close,30) and ta.ema(close,30)>ta.ema(close,40) and ta.ema(close,40)>ta.ema(close,50) and close >ta.ema(close,20)
// Define Buy Condition
buyCondition1 = (percentR>percentR[1] and percentR[1]>percentR[2] and percentR[2]>percentR[3]) and percentR>-20 and percentR[1]>-20
buyCondition = (close> xMA and close> xEMA) and (close > open and close > close[1]) or xMA>xEMA and close<day_highrange and hmacondition and emacondition
// Define Sell Conditions
sellCondition = (close < xMA and close < xEMA) or xMA<xEMA or percentR<-80
// Strategy Execution
if (buyCondition and buyCondition1 and valid_entry_condition)
strategy.entry("Buy", strategy.long)
if (sellCondition)
strategy.close("Buy") // Close the long position
// Candle coloring for buy/sell indication
barcolor(buyCondition ? color.green : sellCondition ? color.red : na)
plot(higherline, color=color.olive, title="EMA")
plot(higherline, color=color.black, title="EMA")