अवलोकन
रणनीति एक तकनीकी विश्लेषण पर आधारित एक एकीकृत ट्रेडिंग प्रणाली है, जो समर्थन प्रतिरोध क्षेत्रों, चार्ट पैटर्न और बाजार संरचना विश्लेषण को जोड़ती है। रणनीति महत्वपूर्ण मूल्य स्तरों की पहचान करके, चार्ट संकेतों की पुष्टि करके और समग्र बाजार रुझानों का आकलन करके व्यापार निर्णय लेती है। प्रणाली 1: 3 जोखिम-लाभ अनुपात का उपयोग करती है, जो पूर्व निर्धारित स्टॉप-लॉस और लाभ-लाभ लक्ष्यों के माध्यम से जोखिम का प्रबंधन करती है।
रणनीति सिद्धांत
इस रणनीति का मूल तर्क निम्नलिखित प्रमुख घटकों पर आधारित हैः
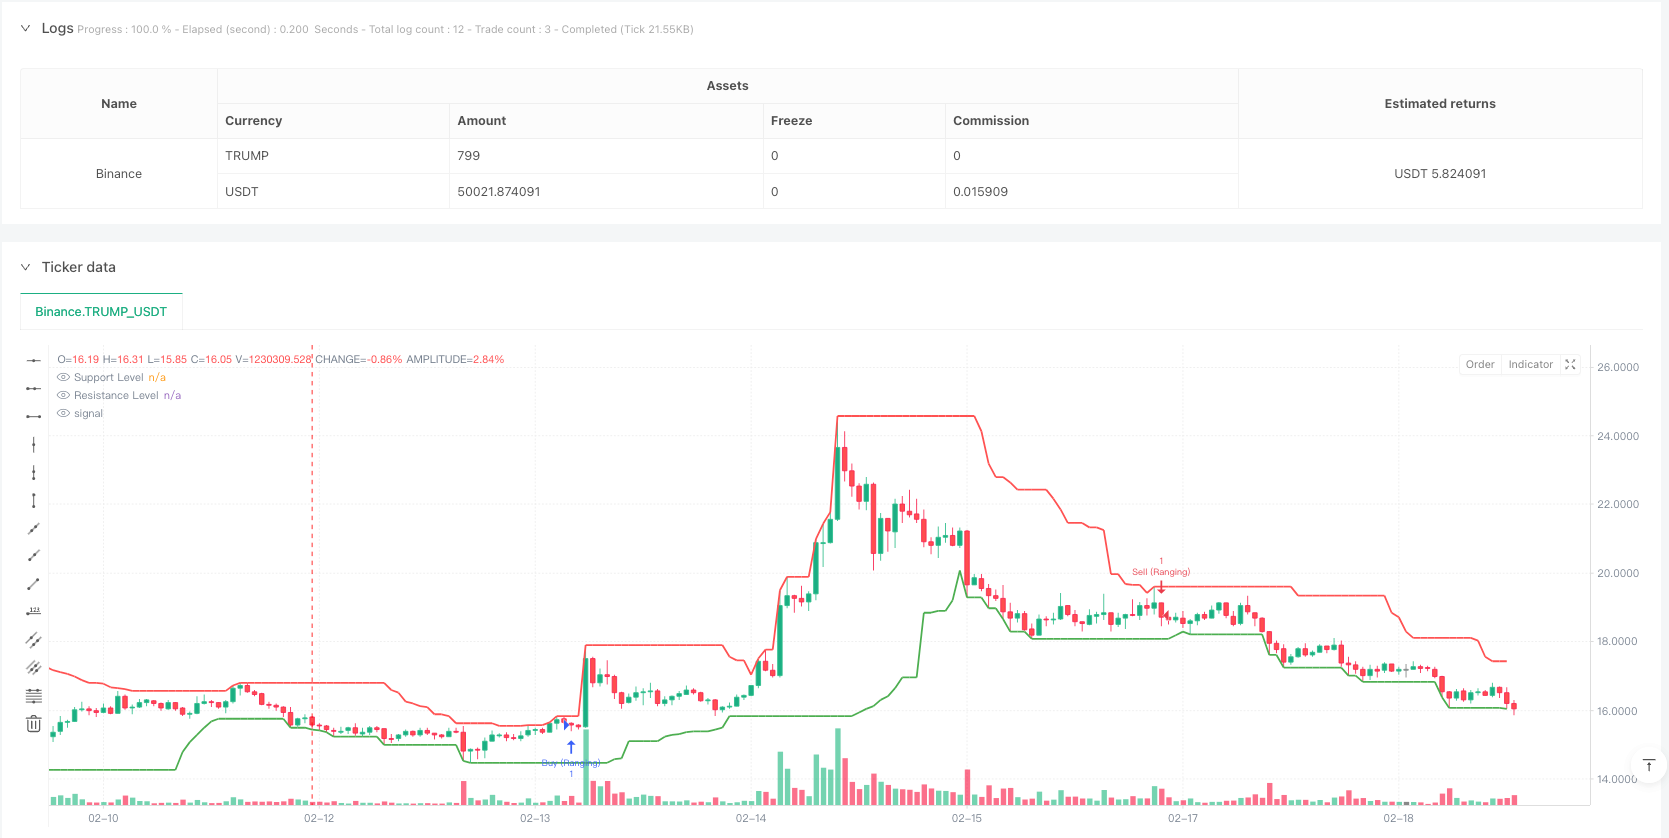
- समर्थन और प्रतिरोध क्षेत्रों की पहचान - महत्वपूर्ण मूल्य स्तरों को निर्धारित करने के लिए पिछले 20 चक्रों के उच्चतम और निम्नतम मूल्य का उपयोग करना
- पहेली आकृतियों की पुष्टि - पहेली निगलने, पहेली निगलने, कण रेखा और उल्का रेखा जैसे विशिष्ट रूपों सहित
- बाजार संरचना विश्लेषण - उच्च और निम्न बिंदुओं की तुलनात्मक श्रृंखला के माध्यम से यह निर्धारित करने के लिए कि क्या बाजार एक उछाल, गिरावट या अस्थिरता में है
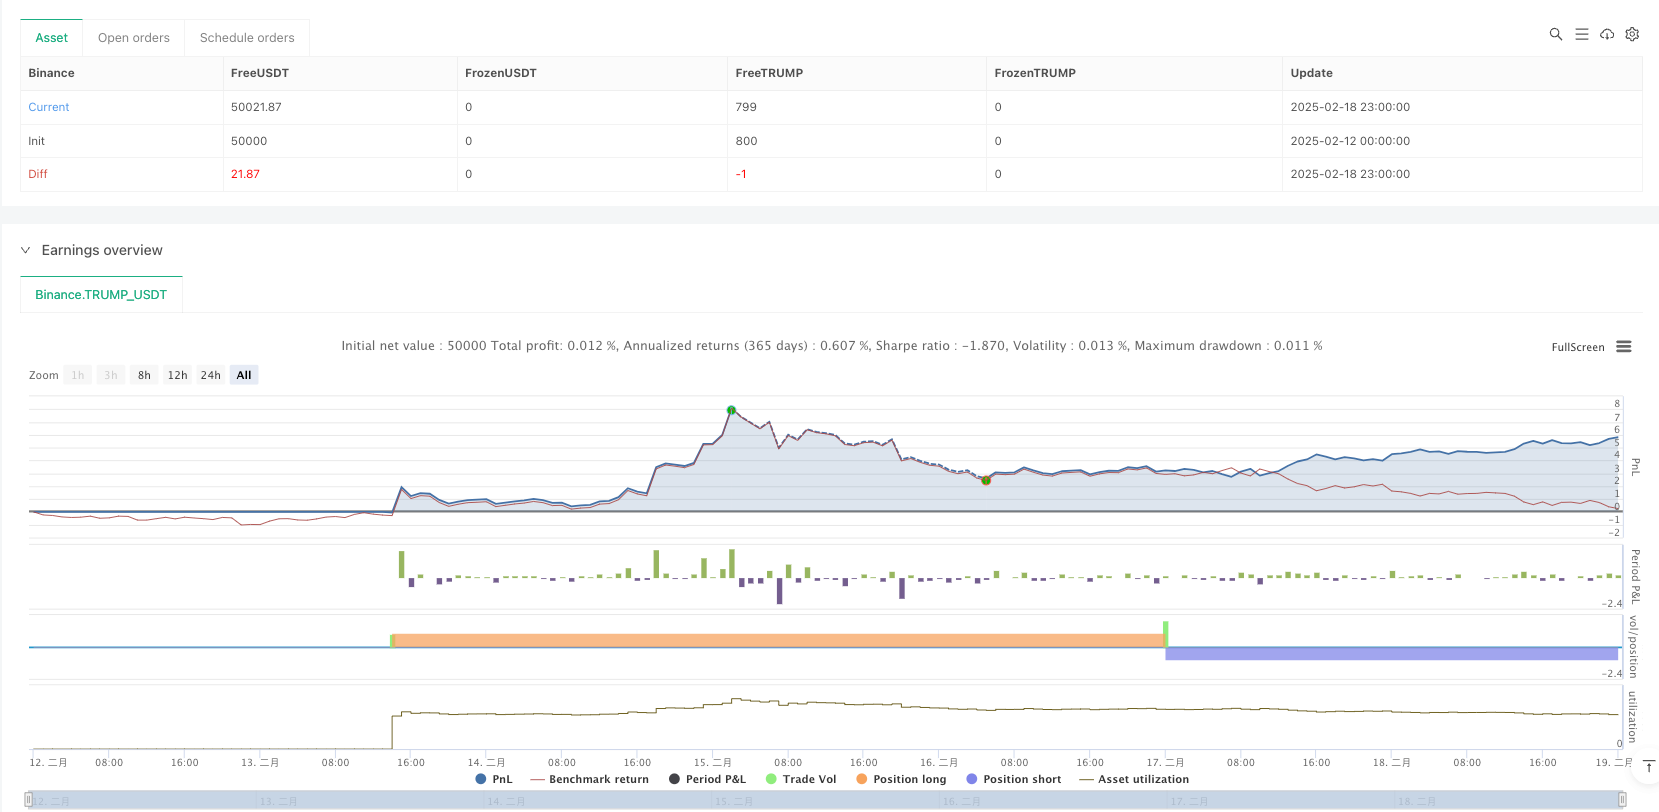
- जोखिम प्रबंधन - स्टॉप पोजीशन सेट करने के लिए एक निश्चित स्टॉप लॉस पॉइंट और 1: 3 जोखिम-लाभ अनुपात का उपयोग करना
रणनीति तीन प्रकार के बाजार परिवेशों में काम करती हैः ट्रेंडिंग, इंटरमीडिएट और टर्नअराउंड बाजार, लेकिन प्रत्येक परिवेश के लिए अलग-अलग व्यापार नियमों के संयोजन का उपयोग किया जाता है।
रणनीतिक लाभ
- बहुआयामी विश्लेषण - मूल्य स्तर, आरेख और बाजार संरचना को एकीकृत करके अधिक विश्वसनीय व्यापारिक संकेत प्रदान करता है
- अनुकूलनशीलता - विभिन्न बाजार स्थितियों, रुझानों और अंतराल सहित अनुकूलन करने की क्षमता
- बेहतर जोखिम प्रबंधन - निश्चित जोखिम-लाभ अनुपात का उपयोग करके, यह सुनिश्चित करें कि प्रत्येक लेनदेन पर स्पष्ट जोखिम नियंत्रण हो
- विज़ुअलाइज़ेशन सपोर्ट - प्रतिरोध क्षेत्रों को ग्राफिकल मार्कअप द्वारा समर्थित किया जाता है, जिससे व्यापारियों को बाजार की स्थिति को समझने में मदद मिलती है
रणनीतिक जोखिम
- झूठी दरार का जोखिम - कीमतें तेजी से पीछे हट सकती हैं, झूठे संकेत दे सकती हैं
- स्लाइडिंग जोखिम - अत्यधिक उतार-चढ़ाव के समय में, वास्तविक लेनदेन की कीमतें उम्मीदों से अधिक विचलित हो सकती हैं
- पैरामीटर संवेदनशीलता - प्रतिरोध चक्र, बाजार संरचना चक्र आदि जैसे पैरामीटर का चयन रणनीति के प्रदर्शन को महत्वपूर्ण रूप से प्रभावित करता है
- बाजार की स्थिति पर निर्भरता - तेजी से एकतरफा या अत्यधिक अस्थिर बाजारों में खराब प्रदर्शन
रणनीति अनुकूलन दिशा
- गतिशील पैरामीटर समायोजन - बाजार में उतार-चढ़ाव के आधार पर समर्थन प्रतिरोध क्षेत्रों को स्वचालित रूप से समायोजित करने के लिए गणना चक्र
- फ़िल्टर बढ़ाएँ - झूठे ब्रेकआउट सिग्नल को फ़िल्टर करने के लिए ट्रैफ़िक, अस्थिरता और अन्य मापदंडों को जोड़ें
- स्टॉप लॉस ऑप्टिमाइज़ेशन - एटीआर-आधारित गतिशील स्टॉप लॉस सेटिंग्स को लागू करना, बाजार में उतार-चढ़ाव के लिए अनुकूलनशीलता में सुधार करना
- समय सीमा सत्यापन - सिग्नल की विश्वसनीयता बढ़ाने के लिए बहु-समय सीमा विश्लेषण की शुरूआत
- स्थिति प्रबंधन अनुकूलन - बाजार की अस्थिरता और सिग्नल की ताकत के आधार पर स्थिति को गतिशील रूप से समायोजित करना
संक्षेप
इस रणनीति में कई तकनीकी विश्लेषण उपकरण का एकीकृत उपयोग करके एक पूर्ण व्यापार प्रणाली का निर्माण किया गया है। इसका लाभ बहुआयामी विश्लेषण और पूर्ण जोखिम प्रबंधन में है, लेकिन साथ ही साथ झूठी सफलता और पैरामीटर संवेदनशीलता जैसी चुनौतियों का सामना करना पड़ता है। प्रस्तावित अनुकूलन दिशा के माध्यम से, रणनीति को मौजूदा लाभ के आधार पर स्थिरता और अनुकूलनशीलता को और बढ़ाने की उम्मीद है। इस रणनीति को सफलतापूर्वक लागू करने के लिए, व्यापारियों को विभिन्न घटकों की गहरी समझ की आवश्यकता होती है और वास्तविक बाजार की स्थिति के अनुसार उचित पैरामीटर समायोजन की आवश्यकता होती है।
/*backtest
start: 2025-02-12 00:00:00
end: 2025-02-19 00:00:00
period: 1h
basePeriod: 1h
exchanges: [{"eid":"Binance","currency":"TRUMP_USDT"}]
*/

//@version=5
strategy("Support/Resistance Strategy with Candlestick Confirmation, Market Structure, and 1:3 R:R", overlay=true)

// Input parameters
supportResistancePeriod = input.int(20, title="Support/Resistance Period", minval=1)
stopLossPips = input.int(50, title="Stop Loss (in pips)", minval=1)
takeProfitRatio = input.float(3.0, title="Risk-to-Reward Ratio", minval=1.0)
structurePeriod = input.int(20, title="Market Structure Period", minval=1)  // Period to determine market structure

// Function to calculate support level (lowest low in the period)
getSupportLevel() =>
    ta.lowest(low, supportResistancePeriod)

// Function to calculate resistance level (highest high in the period)
getResistanceLevel() =>
    ta.highest(high, supportResistancePeriod)

// Get the support and resistance levels
supportLevel = getSupportLevel()
resistanceLevel = getResistanceLevel()

// Function to detect market structure
isBullishTrend() =>
    high[structurePeriod] > high[structurePeriod+1] and low[structurePeriod] > low[structurePeriod+1]

isBearishTrend() =>
    high[structurePeriod] < high[structurePeriod+1] and low[structurePeriod] < low[structurePeriod+1]

isRanging() =>
    not isBullishTrend() and not isBearishTrend()

// Candlestick Pattern Detection Functions
isBullishEngulfing() =>
    close[1] < open[1] and close > open and close > open[1] and open < close[1]

isBearishEngulfing() =>
    close[1] > open[1] and close < open and close < open[1] and open > close[1]

isDoji() =>
    math.abs(close - open) <= (high - low) * 0.1

isHammer() =>
    body = math.abs(close - open)
    upperShadow = high - math.max(close, open)
    lowerShadow = math.min(close, open) - low
    body <= (high - low) * 0.3 and lowerShadow > body * 2 and upperShadow <= body * 0.5

isShootingStar() =>
    body = math.abs(close - open)
    upperShadow = high - math.max(close, open)
    lowerShadow = math.min(close, open) - low
    body <= (high - low) * 0.3 and upperShadow > body * 2 and lowerShadow <= body * 0.5

// Conditions for Buy and Sell based on candle close
buyCondition = (isBullishEngulfing() or isHammer()) and close > supportLevel
sellCondition = (isBearishEngulfing() or isShootingStar()) and close < resistanceLevel

// Define buy/sell conditions based on market structure
bullishMarket = isBullishTrend() and buyCondition
bearishMarket = isBearishTrend() and sellCondition
rangingMarket = isRanging() and (buyCondition or sellCondition)

// Calculate the Stop Loss and Take Profit Levels
longStopLoss = supportLevel - (stopLossPips * syminfo.mintick)
shortStopLoss = resistanceLevel + (stopLossPips * syminfo.mintick)

// Calculate R:R based Take Profit Levels
longTakeProfit = close + (math.abs(close - longStopLoss) * takeProfitRatio)
shortTakeProfit = close - (math.abs(close - shortStopLoss) * takeProfitRatio)

// Plotting Support and Resistance Lines
plot(supportLevel, color=color.green, linewidth=2, title="Support Level", style=plot.style_line)
plot(resistanceLevel, color=color.red, linewidth=2, title="Resistance Level", style=plot.style_line)

// Strategy: Buy on Support, Sell on Resistance with candlestick confirmation and market structure
if (bullishMarket)
    strategy.entry("Buy", strategy.long, stop=longStopLoss, limit=longTakeProfit)

if (bearishMarket)
    strategy.entry("Sell", strategy.short, stop=shortStopLoss, limit=shortTakeProfit)

if (rangingMarket)
    if (buyCondition)
        strategy.entry("Buy (Ranging)", strategy.long, stop=longStopLoss, limit=longTakeProfit)
    if (sellCondition)
        strategy.entry("Sell (Ranging)", strategy.short, stop=shortStopLoss, limit=shortTakeProfit)

// Optional: Highlighting the zones for support and resistance
bgcolor(close > resistanceLevel ? color.new(color.red, 90) : na, title="Resistance Zone")
bgcolor(close < supportLevel ? color.new(color.green, 90) : na, title="Support Zone")