बहु-अवधि प्रवृत्ति ट्रैकिंग और वॉल्यूम पुष्टिकरण रणनीति

अवलोकन
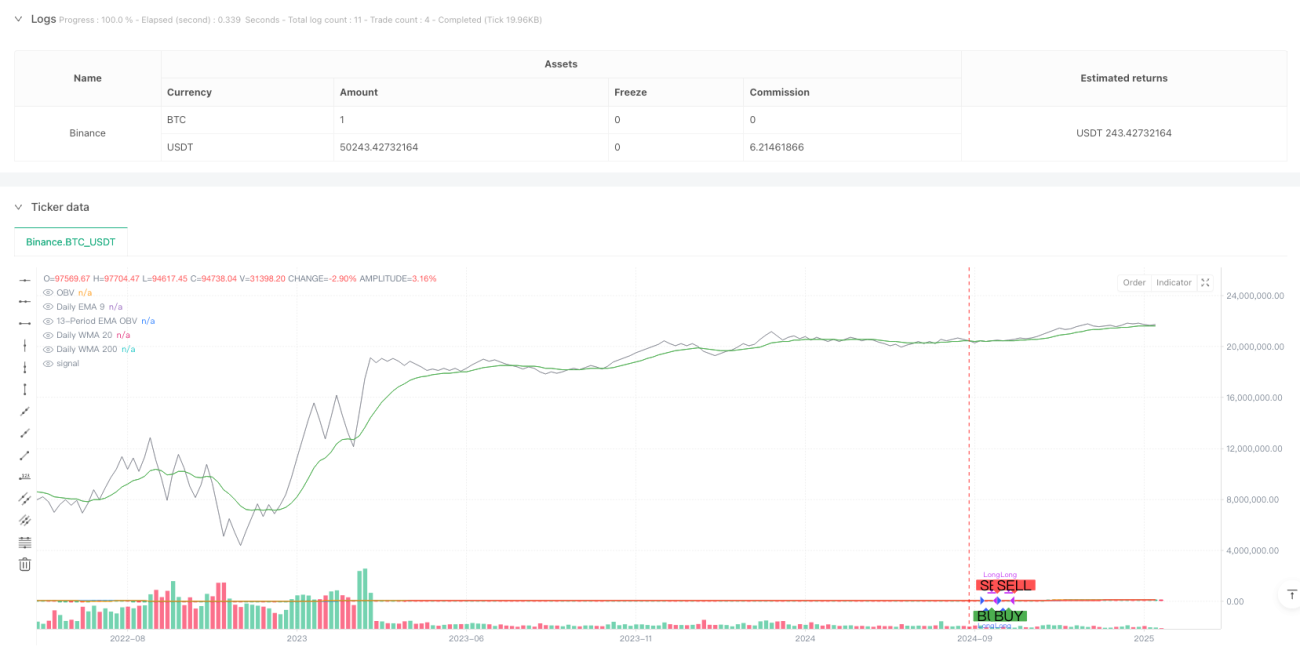
यह रणनीति एक ट्रेंड ट्रैकिंग सिस्टम है जो बहु-आयामी चलती औसत और लेन-देन की मात्रा के विश्लेषण को जोड़ती है। रणनीति ईएमए 9, डब्ल्यूएमए 20 और डब्ल्यूएमए 200 की तीन औसत रेखाओं के माध्यम से समग्र प्रवृत्ति की पुष्टि करती है, जबकि ओबीवी (ऑन बैलेंस वॉल्यूम) सूचक और ईएमए को ट्रेड वॉल्यूम की पुष्टि करने के लिए पेश किया जाता है, जिससे अधिक मजबूत ट्रेंड ट्रैकिंग ट्रेडों की अनुमति मिलती है।
रणनीति सिद्धांत
यह रणनीति दो मुख्य शर्तों पर आधारित हैः
- प्रवृत्ति की पुष्टि - यह निर्धारित करके प्रवृत्ति की दिशा की पुष्टि करें कि क्या तीनों दिन की औसत रेखाएं (ईएमए 9, डब्ल्यूएमए 20, डब्ल्यूएमए 200) बढ़ रही हैं। जब तीनों औसत रेखाएं ऊपर की ओर झुकाव करती हैं, तो यह दर्शाता है कि प्रत्येक समय अवधि में एक बहुमुखी प्रवृत्ति है।
- लेन-देन की पुष्टि - लेन-देन का विश्लेषण ओबीवी सूचक और उसके 13 चक्र ईएमए का उपयोग करके किया जाता है। जब ओबीवी का ईएमए ओबीवी से ऊपर होता है, तो यह दर्शाता है कि लेन-देन की मात्रा कीमतों में वृद्धि को समर्थन देती है, जो प्रवृत्ति की प्रभावशीलता की पुष्टि करती है।
यदि दोनों शर्तों को एक साथ पूरा किया जाता है, तो एक रणनीति एक बहुसंकेत उत्पन्न करती है। यदि कोई भी शर्त नहीं है, तो एक रणनीति बाहर निकलती है।
रणनीतिक लाभ
- एकाधिक समय सीमा विश्लेषण - अल्पकालिक (ईएमए 9), मध्यम (डब्ल्यूएमए 20), और दीर्घकालिक (डब्ल्यूएमए 200) रुझानों को समेकित करके झूठी दरारों के जोखिम को कम करें।
- लेन-देन का समर्थन - ओबीवी सूचक विश्लेषण को शामिल करें, यह सुनिश्चित करने के लिए कि मूल्य आंदोलन को लेन-देन का समर्थन मिल रहा है।
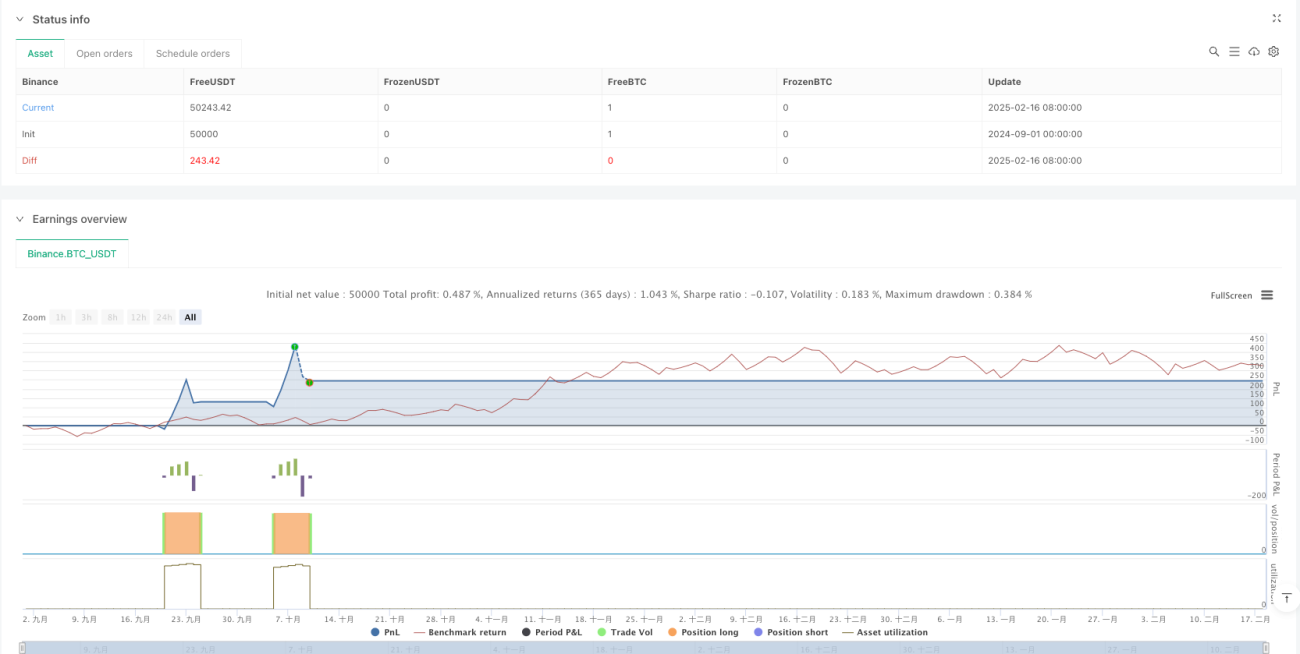
- बेहतर जोखिम नियंत्रण - वास्तविक व्यापारिक परिवेश के अनुरूप प्रतिशत स्थिति प्रबंधन और प्रभार विचार।
- दृश्य सहायता - स्पष्ट ग्राफिक्स मार्किंग के माध्यम से व्यापारियों को प्रवेश और बाहर निकलने के समय को समझने में मदद करें।
रणनीतिक जोखिम
- रुझान उलटने में देरी - बहु-समान रेखा पुष्टिकरण के उपयोग के कारण, रुझान उलटने की शुरुआत में प्रतिक्रिया धीमी हो सकती है।
- अस्थिर बाजारों पर लागू नहीं होता है - बार-बार झूठे टूटने से लेन-देन की अधिकता हो सकती है।
- पूंजीगत लागत पर विचार करें - 0.1% की प्रसंस्करण शुल्क उच्च आवृत्ति ट्रेडिंग में आय पर महत्वपूर्ण प्रभाव डाल सकती है।
रणनीति अनुकूलन दिशा
- अस्थिरता संकेतक का परिचय - एटीआर जैसे अस्थिरता संकेतक को जोड़ने पर विचार किया जा सकता है, जो विभिन्न बाजार स्थितियों में स्थिति को गतिशील रूप से समायोजित करता है।
- स्टॉप लॉस तंत्र में सुधार - लाभ की बेहतर सुरक्षा के लिए स्टॉप लॉस ट्रैकिंग की सिफारिश की गई है।
- बाजार परिवेश फ़िल्टर - बाजार परिवेश निर्णय के लिए एक सूचक जोड़ें, जो बाजार में उतार-चढ़ाव के दौरान व्यापार की आवृत्ति को कम करता है या व्यापार को रोकता है।
- ऑप्टिमाइज़ेशन पैरामीटर का चयन - विभिन्न बाजारों और किस्मों के लिए औसत चक्र और ओबीवी पैरामीटर का अनुकूलन करने पर विचार करें।
संक्षेप
इस रणनीति के संयोजन के माध्यम से बहु-चक्र प्रवृत्ति विश्लेषण और लेन-देन की मात्रा की पुष्टि, एक अपेक्षाकृत पूर्ण प्रवृत्ति ट्रैकिंग प्रणाली का निर्माण। रणनीति तर्क स्पष्ट है, जोखिम नियंत्रण उचित है, लेकिन अभी भी अनुकूलन के लिए जगह है। यह सलाह दी जाती है कि व्यापारियों को सावधानीपूर्वक परीक्षण किया जाए और विशिष्ट बाजार विशेषताओं के अनुसार पैरामीटर को समायोजित किया जाए।
/*backtest
start: 2024-09-01 00:00:00
end: 2025-02-18 08:00:00
period: 5d
basePeriod: 5d
exchanges: [{"eid":"Binance","currency":"BTC_USDT"}]
*/

//@version=6
strategy("Strategy: Daily MAs + OBV", overlay=true, initial_capital=10000, default_qty_type=strategy.percent_of_equity, default_qty_value=10, commission_type=strategy.commission.percent, commission_value=0.1)

//=== Daily Moving Averages Calculation =========================- 1