
अवलोकन
यह रणनीति एक स्टोचैस्टिक ऑस्सिलेटर पर आधारित एक बहु-समय फ्रेम वेव ट्रेडिंग सिस्टम है। यह ट्रेडिंग के अवसरों को निर्धारित करने के लिए वर्तमान समय फ्रेम और उच्चतर समय फ्रेम के यादृच्छिक संकेतक संकेतों के संयोजन के माध्यम से और जोखिम को प्रबंधित करने के लिए गतिशील स्टॉप लॉस का उपयोग करता है। यह रणनीति अत्यधिक अस्थिरता वाले बाजारों के लिए उपयुक्त है, जो कीमतों में अल्पकालिक उतार-चढ़ाव को पकड़कर लाभ प्राप्त करते हैं।
रणनीति सिद्धांत
रणनीति का मूल तर्क निम्नलिखित प्रमुख तत्वों पर आधारित है:
- दो समय फ़्रेमों पर संकेत की पुष्टि के लिए यादृच्छिक संकेतकों का उपयोग करना (वर्तमान और उच्चतर स्तर)
- ओवरबॉय और ओवरसेलिंग क्षेत्रों में क्रॉस सिग्नल की तलाश करें
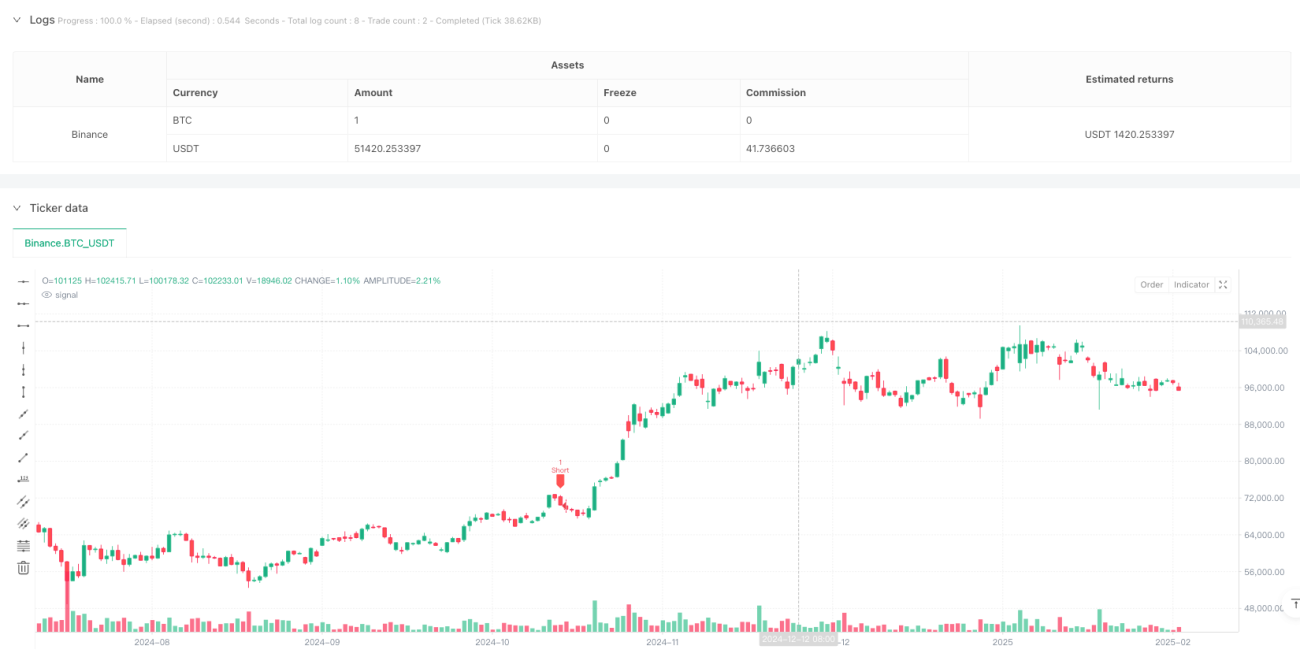
- खरीद की शर्तेंः वर्तमान समय फ़्रेम K लाइन पर D लाइन को पार करें, और K मूल्य <20; उच्च समय फ़्रेम K मूल्य <20 और K> D
- बेचने की शर्तेंः वर्तमान समय फ़्रेम K लाइन के नीचे D लाइन के माध्यम से, और K मान> 80; उच्च समय फ़्रेम K मान> 80 और K < D
- प्रवेश मूल्य के आधार पर गतिशील स्टॉप लॉस सिस्टम का उपयोग करना, स्टॉप लॉस गुणांक समायोज्य
रणनीतिक लाभ
- मल्टी-टाइम फ्रेम सिग्नल की पुष्टि से लेनदेन की विश्वसनीयता बढ़ जाती है और झूठे सिग्नल को कम किया जाता है
- ओवरबॉय और ओवरसोल क्षेत्रों में ट्रेडिंग से रुझान में बदलाव की संभावना बढ़ जाती है
- डायनामिक स्टॉप-स्टॉप-लॉस सिस्टम बाजार में उतार-चढ़ाव के अनुसार स्वचालित रूप से समायोजित हो सकता है, जिससे धन प्रबंधन में लचीलापन बढ़ जाता है
- एक ग्राफिकल इंटरफेस जो व्यापारियों को समझने और संचालित करने के लिए ट्रेडिंग सिग्नल और स्टॉपलॉस की स्थिति को इंगित करता है
- विभिन्न बाजार स्थितियों के लिए रणनीति पैरामीटर समायोज्य
रणनीतिक जोखिम
- अत्यधिक अस्थिर बाजारों में बार-बार स्टॉप लॉस की संभावना
- डबल टाइमफ्रेम की पुष्टि के कारण कुछ ट्रेडिंग अवसरों से चूक सकते हैं
- एक निश्चित गुणांक के साथ स्टॉप-स्टॉप-लॉस सभी बाजार स्थितियों के लिए उपयुक्त नहीं हो सकता है
- जब रुझान मजबूत होता है, तो यह जल्दबाजी होगी
- लाभ और जोखिम को संतुलित करने के लिए उचित मापदंडों की आवश्यकता
रणनीति अनुकूलन दिशा
- बाजार में उतार-चढ़ाव के आधार पर गतिशील समायोजन के लिए एक अनुकूलन स्टॉप-लॉस तंत्र की शुरूआत
- प्रवृत्ति फ़िल्टर जोड़ें और मजबूत प्रवृत्ति के दौरान ट्रेडिंग दिशा को समायोजित करें
- एक सहायक पुष्टिकरण संकेत के रूप में लेन-देन की मात्रा का संकेत जोड़ना
- अधिक बुद्धिमान स्टॉक मैनेजमेंट सिस्टम विकसित करना
- बाजार में प्रवेश के समय को अनुकूलित करने के लिए बाजार भावनाओं के संकेतकों को शामिल करने पर विचार करें
संक्षेप
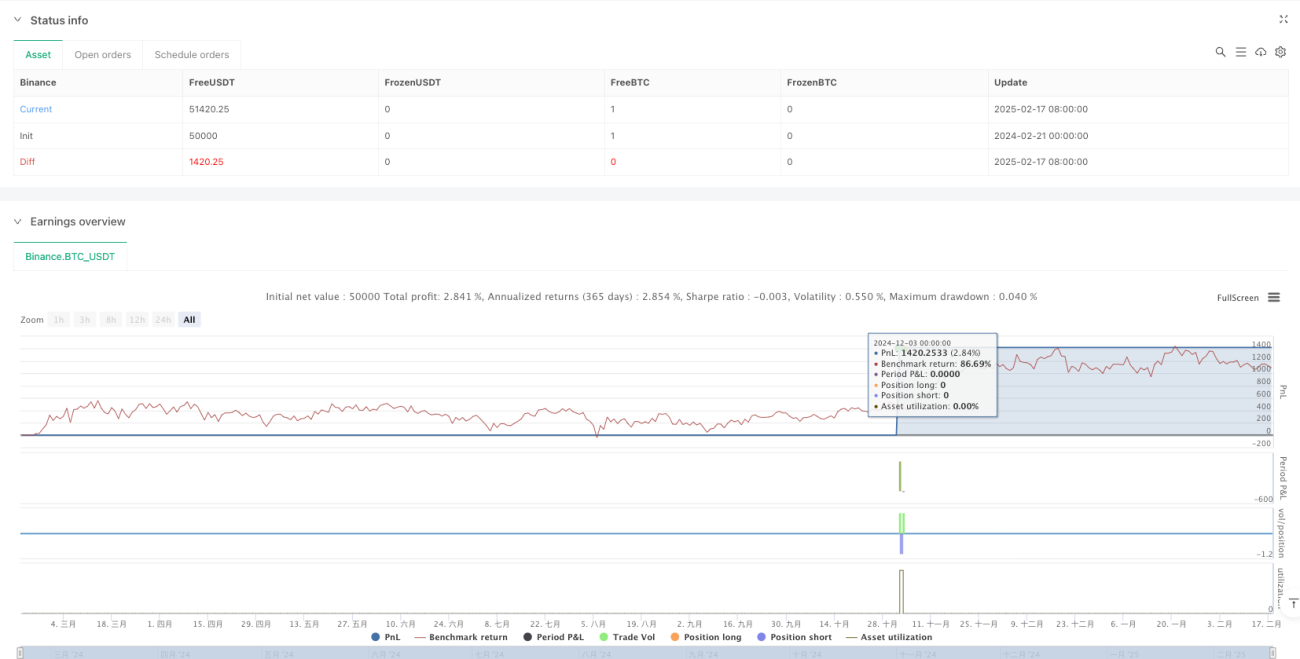
यह तकनीकी विश्लेषण और जोखिम प्रबंधन के संयोजन के साथ एक पूर्ण ट्रेडिंग प्रणाली है। रणनीति में स्थिरता की गारंटी के साथ-साथ कई समय के फ्रेम पर सिग्नल की पुष्टि और गतिशील स्टॉप-लॉस के माध्यम से बेहतर रिटर्न क्षमता है। हालांकि, उपयोगकर्ताओं को अपनी ट्रेडिंग शैली और बाजार की स्थिति के अनुसार पैरामीटर को अनुकूलित करने की आवश्यकता होती है, और हमेशा सख्त जोखिम नियंत्रण बनाए रखना पड़ता है।
- 1