गतिशील अनुकूली बहु-समय अवधि प्रवृत्ति ट्रैकिंग और शॉक रिवर्सल समग्र रणनीति

अवलोकन
यह रणनीति एक जटिल ट्रेडिंग प्रणाली है जिसमें ट्रेंड ट्रैकिंग और स्पेस ट्रेडिंग शामिल है, जो कि मार्केट स्टेटस की पहचान के लिए Ichimoku क्लाउड चार्ट के माध्यम से है, जो MACD गतिशीलता की पुष्टि और RSI ओवरबॉय ओवरसोल सूचक के साथ मिलकर है, जबकि एटीआर को गतिशील स्टॉप लॉस मैनेजमेंट के लिए उपयोग किया जाता है। यह रणनीति ट्रेंडिंग मार्केट में ट्रेंडिंग अवसरों को पकड़ने में सक्षम है, जो अस्थिर बाजार में पलटाव के अवसरों की तलाश में है, जिसमें मजबूत अनुकूलनशीलता और लचीलापन है।
रणनीति सिद्धांत
इस रणनीति में सिग्नल की पुष्टि के लिए कई स्तरों का इस्तेमाल किया गया है:
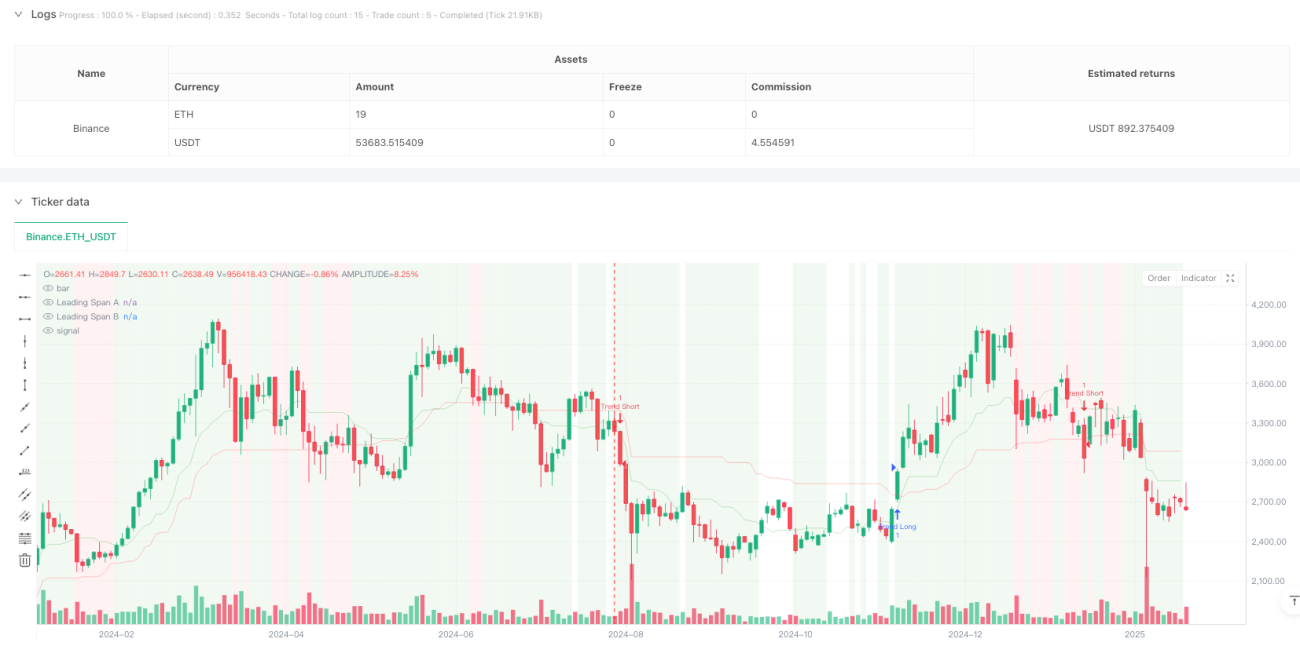
- इचिमोकु क्लाउड चार्ट का उपयोग बाजार की स्थिति के लिए मुख्य आधार के रूप में किया जाता है, यह निर्धारित करने के लिए कि बाजार प्रवृत्ति या अस्थिरता में है या नहीं
- रुझान बाजार में, जब कीमत बादल के ऊपर होती है और आरएसआई> 55 है, तो एमएसीडी पिलर पॉजिटिव होता है; जब कीमत बादल के नीचे होती है और आरएसआई <45 है, तो एमएसीडी पिलर नकारात्मक होता है, तो शून्य होता है
- अस्थिर बाजारों में, जब आरएसआई <30 और यादृच्छिक आरएसआई <20 है, तो अधिक अवसरों की तलाश करें; जब आरएसआई> 70 और यादृच्छिक आरएसआई> 80 है, तो कमोडिटी अवसरों की तलाश करें
- एटीआर-आधारित गतिशील स्टॉप लॉस का उपयोग करके जोखिम का प्रबंधन करें, एटीआर मूल्य से दो गुना स्टॉप लॉस दूरी
रणनीतिक लाभ
- बाजार अनुकूलन क्षमताः विभिन्न बाजार स्थितियों के अनुसार ट्रेडिंग रणनीतियों को स्वचालित रूप से समायोजित करने की क्षमता, रणनीतियों की स्थिरता में सुधार
- उच्च सिग्नल विश्वसनीयताः झूठे संकेतों के प्रभाव को कम करने के लिए बहु-सूचक सत्यापन तंत्र का उपयोग करना
- जोखिम नियंत्रण में सुधारः एटीआर के माध्यम से गतिशील स्टॉप लॉस, लाभप्रदता को पूरा करने और जोखिम को प्रभावी ढंग से नियंत्रित करने के लिए
- अच्छा दृश्य प्रभावः पृष्ठभूमि रंगों के माध्यम से बाजार की स्थिति को चिह्नित करना, जिससे व्यापारियों को बाजार की स्थिति को समझने में मदद मिलती है
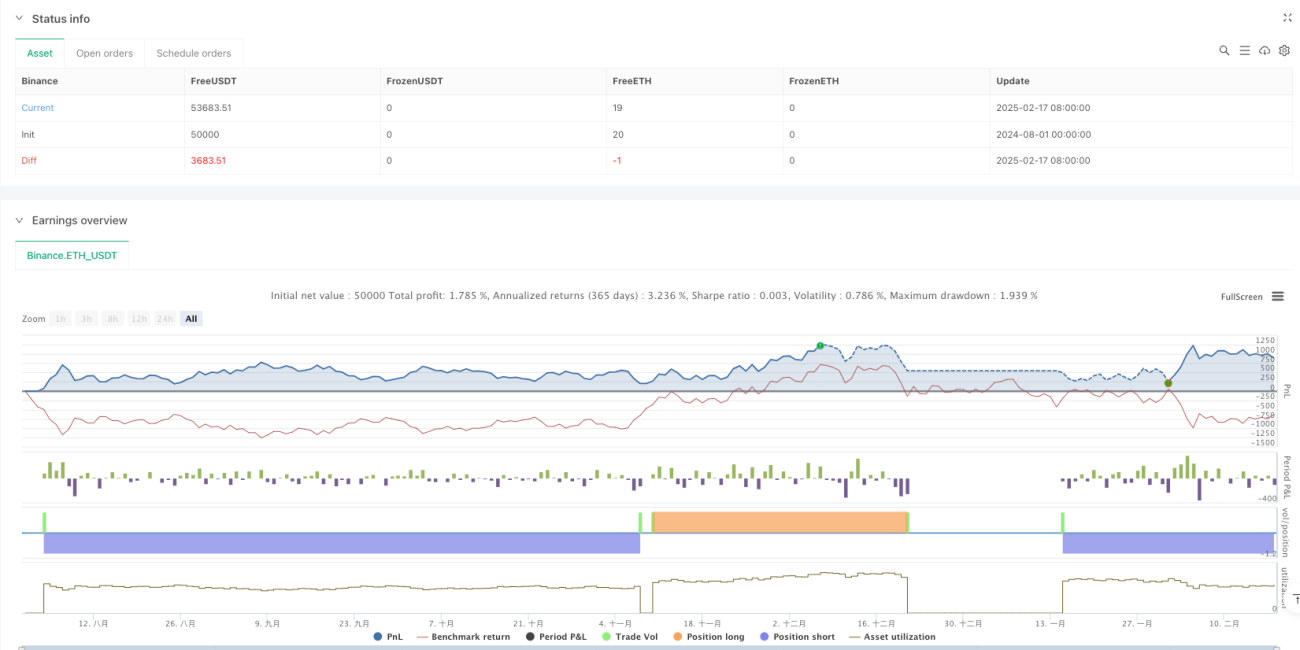
- उच्च समय चक्र प्रदर्शन उत्कृष्टः 2.159 के लाभ कारक के साथ सूर्य रेखा चक्र पर, 10.71% का शुद्ध लाभ
रणनीतिक जोखिम
- कम सफलता दरः सभी समय चक्रों में 40% से कम सफलता दर, मजबूत मानसिक सहनशक्ति की आवश्यकता
- कम समय चक्र ओवरट्रेडिंगः 4 घंटे की अवधि में 430 ट्रेडों का निष्पादन, कम दक्षता
- सिग्नल लेगिंगः बहु-सूचक सत्यापन के उपयोग के कारण कुछ बाजार के अवसरों को याद किया जा सकता है
- पैरामीटर का अनुकूलन करना मुश्किल हैः कई मापदंडों के संयोजन से रणनीति अनुकूलन की जटिलता बढ़ जाती है
रणनीति अनुकूलन दिशा
- सिग्नल फ़िल्टरिंग ऑप्टिमाइज़ेशनः जीत की दर को बढ़ाने के लिए प्रत्येक सूचकांक के थ्रेशोल्ड को समायोजित करें
- समय चक्र अनुकूलनः यह मुख्य रूप से सूर्य रेखा और ऊपर चक्र में उपयोग करने के लिए सिफारिश की है, विभिन्न बाजार विशेषताओं के अनुसार पैरामीटर को समायोजित कर सकते हैं
- स्टॉप लॉस ऑप्टिमाइज़ेशनः एटीआर गुणांक को विभिन्न बाजार स्थितियों की गतिशीलता के अनुसार समायोजित करने पर विचार किया जा सकता है
- प्रवेश समय अनुकूलनः प्रवेश की सटीकता बढ़ाने के लिए मात्रा की पुष्टि या मूल्य प्रारूप की पुष्टि जोड़ सकते हैं
- स्थिति प्रबंधन अनुकूलनः सिग्नल की ताकत के आधार पर एक गतिशील स्थिति प्रबंधन प्रणाली डिजाइन की जा सकती है
संक्षेप
यह रणनीति एक तर्कसंगत, तर्कसंगत और स्पष्ट एकीकृत व्यापार प्रणाली है, जो कई संकेतकों के संयोजन के उपयोग के माध्यम से बाजार की स्थिति की बुद्धिमान पहचान और व्यापार के अवसरों को सटीक रूप से पकड़ने में सक्षम है। हालांकि कम समय अवधि में कुछ समस्याएं हैं, लेकिन उच्च समय अवधि में उत्कृष्ट प्रदर्शन करते हैं, जैसे कि डेली लाइन। यह सलाह दी जाती है कि व्यापारी वास्तविक समय में डेली लाइन स्तर के संकेतों पर ध्यान केंद्रित करें और अपने जोखिम सहनशीलता के आधार पर पैरामीटर को उचित रूप से समायोजित करें। निरंतर अनुकूलन और समायोजन के साथ, यह रणनीति व्यापार प्रदाताओं के लिए स्थिर मुनाफे के अवसरों की उम्मीद करती है।
- 1