डायनेमिक ईएमए क्रॉसओवर स्विंग हाई लो एडेप्टिव स्ट्रैटेजी

अवलोकन
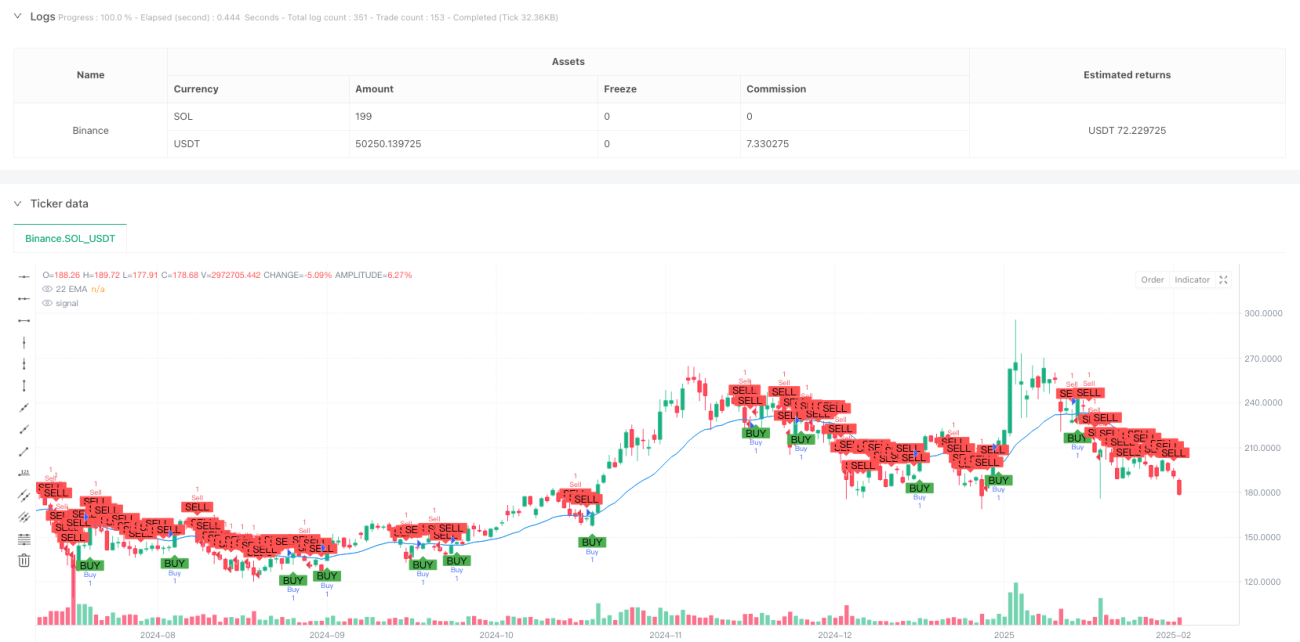
यह रणनीति 22 चक्र सूचकांक चलती औसत (ईएमए) के आधार पर क्रॉस सिग्नल और स्विंग पॉइंट बिट्स की एक ट्रेडिंग प्रणाली है। यह ईएमए के साथ कीमत के क्रॉसिंग के माध्यम से ट्रेडिंग सिग्नल उत्पन्न करता है और स्टॉप-लॉस पोजीशन को स्थापित करने के लिए अनुकूलित स्विंग ऊंचाई और निचले बिंदुओं का उपयोग करता है। इस पद्धति से ट्रेंड ट्रैकिंग की बुनियादी कार्यक्षमता सुनिश्चित होती है और जोखिम प्रबंधन के लिए लचीलापन बढ़ जाता है।
रणनीति सिद्धांत
रणनीति के मूल तर्क में निम्नलिखित प्रमुख तत्व शामिल हैं:
- 22 चक्र ईएमए को मुख्य रुझान सूचक के रूप में उपयोग करना, यह चक्र बाजार के शोर को बेहतर ढंग से फ़िल्टर करता है
- EMA को पार करने पर अधिक संकेत ट्रिगर करें और EMA को पार करने पर शून्य संकेत ट्रिगर करें
- 14 चक्रों के ऐतिहासिक आंकड़ों के माध्यम से उच्च और निम्न स्तर की गणना करें
- स्टॉप के रूप में हाल ही में चलती ऊंचाइयों के साथ ओवर-ट्रेडिंग, स्टॉप के रूप में चलती कमियों
- स्टॉप लॉस के रूप में हाल ही में चलती कमियों को लक्षित करके और स्टॉप लॉस के रूप में चलती ऊंचाइयों को लक्षित करते हुए
रणनीतिक लाभ
- प्रवृत्ति के अनुकूलः 22 चक्र ईएमए मध्यम अवधि के रुझानों को प्रभावी ढंग से पकड़ने में सक्षम हैं, जिससे अत्यधिक बार-बार व्यापार से बचा जा सकता है
- गतिशील जोखिम प्रबंधनः स्टॉप-स्टॉप-लॉस बिट्स बाजार में उतार-चढ़ाव के आधार पर स्वचालित रूप से समायोजित होते हैं, जिससे रणनीति की अनुकूलन क्षमता बढ़ जाती है
- स्पष्ट निष्पादनः ट्रेडिंग सिग्नल स्पष्ट हैं, निर्णय के लिए कोई अस्पष्ट क्षेत्र नहीं है
- उचित जोखिम-लाभ अनुपातः प्वाइंट सेट के स्टॉप-स्टॉप को हिलाकर, प्रति ट्रेड के लिए जोखिम-लाभ अनुपात अपेक्षाकृत स्थिर है
- अच्छा दृश्य प्रभावः रणनीति स्पष्ट दृश्य संकेत प्रदान करती है, जिससे व्यापारियों को समझना और निगरानी करना आसान हो जाता है
रणनीतिक जोखिम
- बाजार में उतार-चढ़ाव का खतराः बाज़ार में उतार-चढ़ाव के दौरान अक्सर झूठे ब्रेकआउट सिग्नल उत्पन्न हो सकते हैं
- स्लाइडिंग जोखिमः अत्यधिक उतार-चढ़ाव के दौरान, वास्तविक लेनदेन मूल्य सिग्नल मूल्य से अधिक विचलित हो सकता है
- उछाल जोखिमः बाजार में उतार-चढ़ाव के कारण स्टॉप लॉस की विफलता हो सकती है, जिससे अपेक्षित से अधिक नुकसान हो सकता है
- रुझान में बदलाव का जोखिमः प्रमुख रुझान में बदलाव के बिंदुओं के आसपास लगातार नुकसान हो सकता है
रणनीति अनुकूलन दिशा
- लेन-देन के संकेतकों की शुरूआतः लेन-देन के माध्यम से संकेतों की विश्वसनीयता की पुष्टि की जा सकती है
- प्रवृत्ति फ़िल्टर जोड़ेंः लंबी अवधि के साथ चलती औसत, प्रति-प्रवृत्ति संकेतों को फ़िल्टर करें
- स्टॉप को अनुकूलित करने का तरीकाः एटीआर का उपयोग करके स्टॉप दूरी को गतिशील रूप से समायोजित करने पर विचार किया जा सकता है
- समय फ़िल्टर जोड़ेंः अधिक अस्थिरता से बचने के लिए कुछ समय के लिए बंद करें
- सिग्नल सत्यापन तंत्र विकसित करनाः अन्य तकनीकी संकेतकों के साथ सिग्नल सत्यापन के रूप में, जीत की दर में सुधार करना
संक्षेप
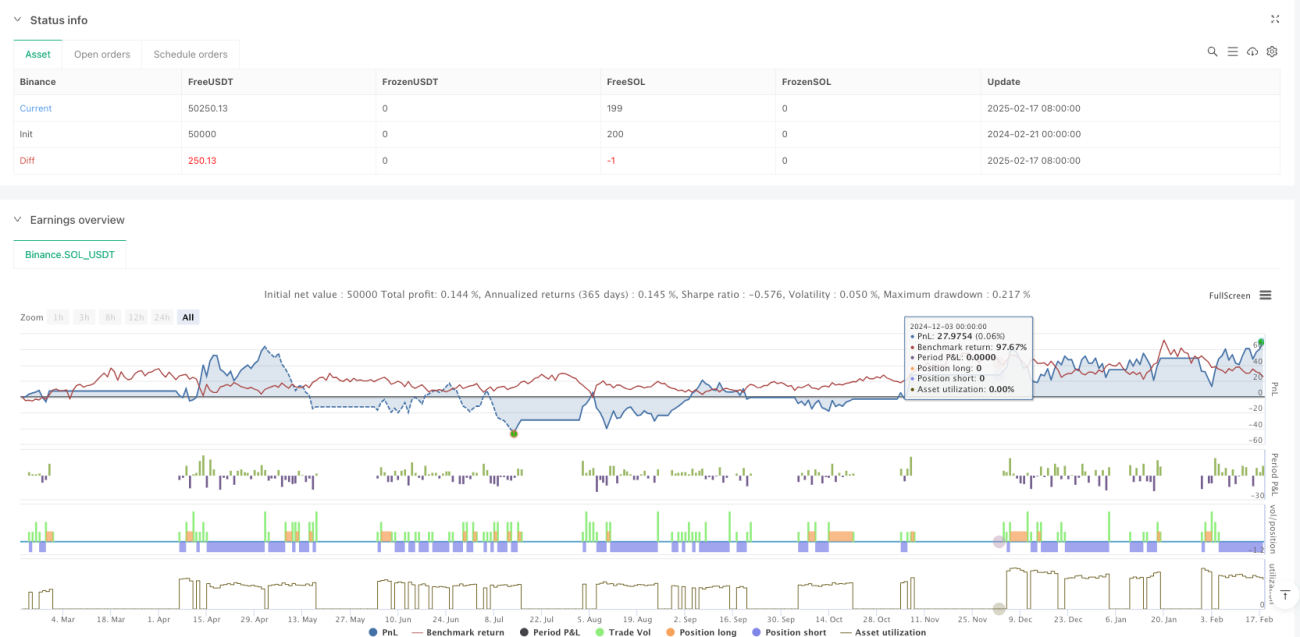
यह एक पूरी तरह से संरचित, स्पष्ट रूप से तार्किक प्रवृत्ति ट्रैकिंग रणनीति है। ईएमए क्रॉसिंग के माध्यम से ट्रेडिंग सिग्नल उत्पन्न करना, एक संतुलित ट्रेडिंग सिस्टम बनाने के लिए अस्थिर बिंदु जोखिम प्रबंधन का उपयोग करना। रणनीति का मुख्य लाभ बाजार की गतिशीलता के अनुकूल होने की क्षमता में है, जबकि मुख्य जोखिम बाजार की स्थिति में परिवर्तन से आता है। प्रस्तावित अनुकूलन दिशा के माध्यम से रणनीति की स्थिरता और लाभप्रदता को और बढ़ाने की उम्मीद है।
- 1