ट्रिपल बोलिंगर बैंड मानक विचलन प्रवृत्ति अनुसरण रणनीति

अवलोकन
यह रणनीति एक बुरिन बैंड मानक विचलन पर आधारित एक प्रवृत्ति ट्रैकिंग ट्रेडिंग प्रणाली है। यह रणनीति बुरिन बैंड के नीचे के स्थान के संबंध में लगातार तीन तारों की स्थिति के संबंध में प्रवृत्ति की ताकत का आकलन करती है, और जब कोई प्रवृत्ति स्थापित होती है, तो व्यापार करती है। प्रणाली प्रति लेनदेन के जोखिम को प्रबंधित करने के लिए एक निश्चित जोखिम-लाभ अनुपात का उपयोग करती है।
रणनीति सिद्धांत
रणनीति का मूल तर्क निम्नलिखित बिंदुओं पर आधारित है:
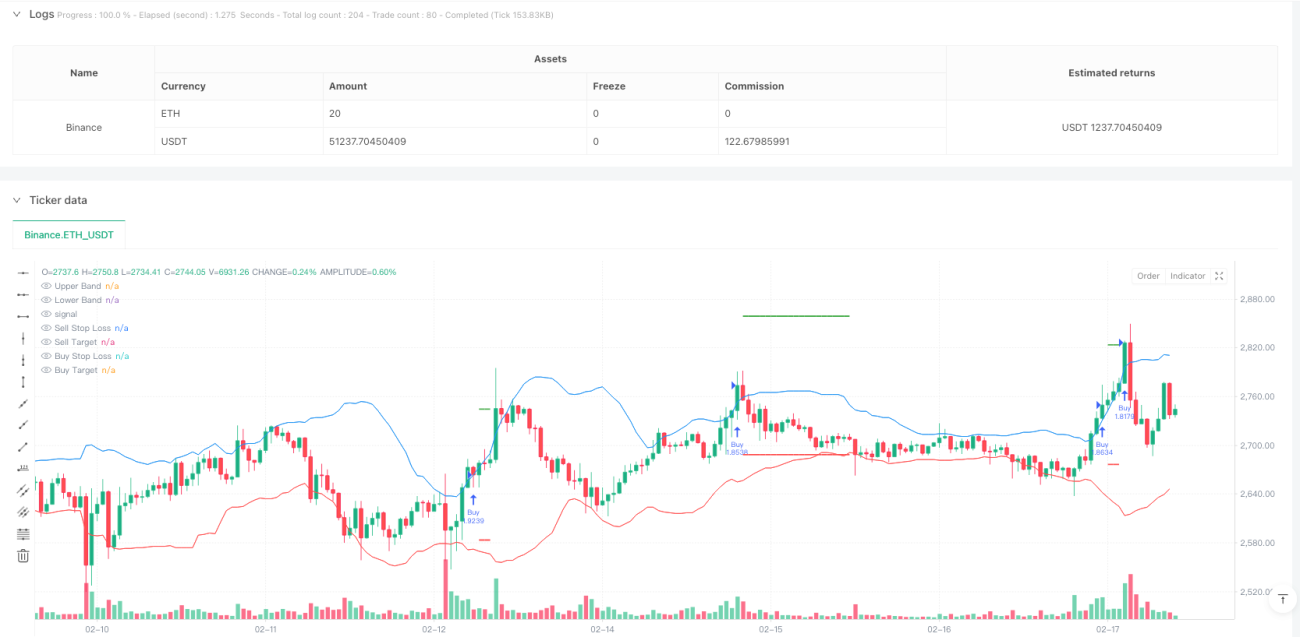
- 20 चक्रों की चलती औसत का उपयोग ब्रिन बैंड के लिए मध्यरेखा के रूप में किया जाता है, और 2 गुना मानक अंतर का उपयोग करके ऊपर और नीचे की ओर गणना की जाती है।
- जब लगातार तीन तारों के समापन की कीमतें ऊपर की ओर होती हैं, तो सिस्टम को लगता है कि ऊपर की ओर का रुझान स्थापित हो गया है, और तीसरे तार के समापन पर अधिक प्रवेश किया जाता है।
- जब लगातार तीन तारों के समापन की कीमतें नीचे की ओर होती हैं, तो सिस्टम मानता है कि गिरावट की प्रवृत्ति स्थापित हो गई है, और तीसरे तार के समापन पर प्रवेश करना शून्य है।
- स्टॉप लॉस को सबसे पहले आने वाले सिग्नल पर सेट किया जाता है।
- लक्ष्य मूल्य की स्थापना 1:1 जोखिम-लाभ अनुपात के साथ की जाती है, अर्थात, लक्ष्य की दूरी को रोकना और लक्ष्य की दूरी को रोकना।
रणनीतिक लाभ
- सिग्नल पुष्टिकरण तंत्र मजबूत है - बुरीन बैंड को तोड़ने के लिए लगातार तीन तारों की आवश्यकता होती है, जो झूठी दरारों के जोखिम को कम करती है।
- उचित जोखिम प्रबंधन - एक निश्चित जोखिम-लाभ अनुपात का उपयोग करके व्यापार प्रबंधन, एकल व्यापार के लिए अत्यधिक नुकसान से बचा जाता है।
- रुझान अनुवर्ती प्रभाव महत्वपूर्ण है - ब्रीनिंग बैंड की मानक विचलन विशेषता रणनीति को बाजार में उतार-चढ़ाव के परिवर्तन के लिए अनुकूलित करने में सक्षम बनाती है।
- निष्पादन के नियम स्पष्ट हैं - प्रवेश, रोक और लाभ के लक्ष्यों की स्थापना के लिए स्पष्ट मात्रात्मक मानदंड हैं, व्यक्तिपरक निर्णय की आवश्यकता नहीं है।
रणनीतिक जोखिम
- अनुप्रस्थ बाजार खराब प्रदर्शन कर रहा है - बिना किसी स्पष्ट प्रवृत्ति वाले बाजारों में अक्सर झूठे संकेत उत्पन्न हो सकते हैं।
- प्रवेश के समय में कुछ देरी - प्रवेश के लिए तीन तारों की पुष्टि की प्रतीक्षा करने की आवश्यकता है, जो कुछ शुरुआती चरणों को याद कर सकता है।
- निश्चित जोखिम-लाभ अनुपात की सीमा - 1:1 का जोखिम-लाभ अनुपात एक मजबूत प्रवृत्ति में लाभप्रदता को बहुत जल्दी समाप्त कर सकता है।
- प्रवृत्ति की ताकत फ़िल्टरिंग का अभाव - केवल मूल्य और ब्रिन बैंड के संबंध पर निर्णय लेना, अन्य प्रवृत्ति पुष्टि संकेतकों को ध्यान में नहीं रखना।
रणनीति अनुकूलन दिशा
- प्रवृत्ति की ताकत फिल्टर बढ़ाएँ - ADX या MACD जैसे प्रवृत्ति संकेतकों को सिग्नल की गुणवत्ता में सुधार करने के लिए पेश किया जा सकता है।
- अनुकूलित जोखिम-लाभ अनुपात सेटिंग्स - बाजार में उतार-चढ़ाव की गतिशीलता के आधार पर जोखिम-लाभ अनुपात को समायोजित किया जा सकता है।
- रोक-टोक तंत्र में सुधार करें - बड़े रुझानों को बेहतर ढंग से पकड़ने के लिए एक गतिशील रोक-टोक या लाभ-बंटवारे के तंत्र को बढ़ाने पर विचार करें।
- लेन-देन की पुष्टि जोड़ें - सिग्नल के निर्माण के दौरान लेन-देन की वृद्धि की पुष्टि करें, जिससे सिग्नल की विश्वसनीयता बढ़ेगी।
संक्षेप
यह एक तर्कसंगत प्रवृत्ति ट्रैकिंग रणनीति है, जो बाजार के रुझानों को बुरिन बैंड और एकाधिक पुष्टि तंत्र के माध्यम से पकड़ने के लिए डिज़ाइन की गई है। रणनीति के लिए जोखिम प्रबंधन ढांचे को पूरा किया गया है, और मानदंडों को स्पष्ट रूप से लागू किया गया है। हालांकि कुछ पिछड़ेपन हैं, लेकिन अनुशंसित अनुकूलन दिशाओं के माध्यम से रणनीति की स्थिरता और लाभप्रदता को और बढ़ाया जा सकता है। प्रवृत्ति ट्रैकिंग पसंद करने वाले और जोखिम नियंत्रण पर ध्यान देने वाले व्यापारियों के लिए यह एक उल्लेखनीय रणनीति ढांचा है।
/*backtest
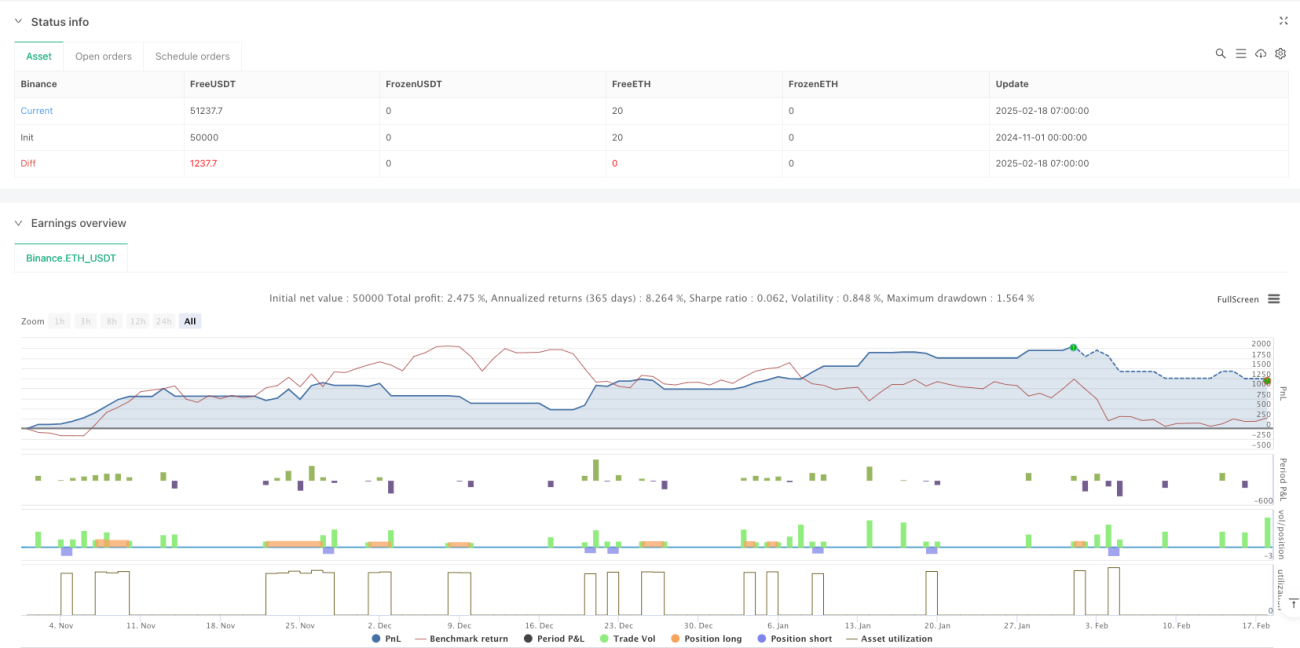
start: 2024-11-01 00:00:00
end: 2025-02-18 08:00:00
period: 1h
basePeriod: 1h
exchanges: [{"eid":"Binance","currency":"ETH_USDT"}]
*/
//@version=6
strategy("Bollinger Band Buy and Sell Strategy (Entry at Close of 3rd Candle)", overlay=true, default_qty_type=strategy.percent_of_equity, default_qty_value=10, pyramiding=0)
// Bollinger Band settings- 1