मल्टी-इंडिकेटर क्रॉस ट्रेंड ट्रैकिंग रणनीति को फिबोनाची रिट्रेसमेंट और स्टॉप-प्रॉफिट और स्टॉप-लॉस ऑप्टिमाइज़ेशन सिस्टम के साथ जोड़ा गया है

अवलोकन
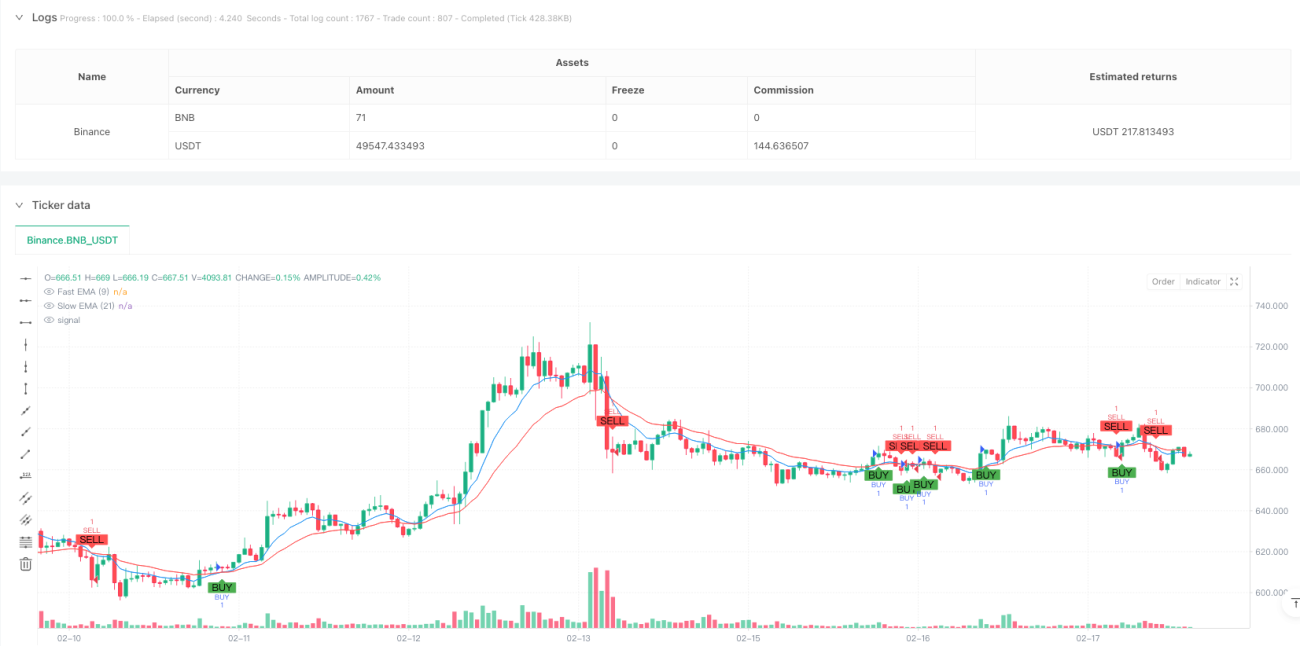
यह रणनीति सूचकांक चलती औसत (ईएमए) के क्रॉसिंग, फिबोनाची रिडक्शन स्तर, प्रवृत्ति निर्णय और स्टॉप-लॉस तंत्र के संयोजन के साथ एक एकीकृत ट्रेडिंग प्रणाली है। रणनीति 9 चक्र और 21 चक्र ईएमए के क्रॉसिंग के माध्यम से ट्रेडिंग संकेतों को निर्धारित करती है, जबकि फिबोनाची रिडक्शन स्तर के संयोजन के साथ प्रवेश बिंदु को अनुकूलित करने के लिए और वास्तविक समय की प्रवृत्ति की स्थिति की निगरानी के माध्यम से ट्रेडिंग की सटीकता में सुधार करने के लिए। प्रणाली में एक प्रतिशत स्टॉप-लॉस तंत्र भी शामिल है, जो प्रभावी रूप से जोखिम को नियंत्रित करता है।
रणनीति सिद्धांत
रणनीति का मूल तर्क निम्नलिखित प्रमुख तत्वों पर आधारित है:
- जब तेजी से ईएमए ((9 चक्र) ऊपर की ओर धीमी गति से ईएमए ((21 चक्र) के माध्यम से गुजरता है, तो सिस्टम एक बहुसंकेत उत्पन्न करता है
- जब तेजी से ईएमए नीचे धीमी गति से ईएमए के माध्यम से गुजरता है, तो सिस्टम एक रिक्त संकेत उत्पन्न करता है
- 100 चक्रों के लिए उच्चतम और निम्नतम कीमतों की गणना करके 23.6%, 38.2%, 50% और 61.8% का फिबोनाची रिवर्स स्तर तैयार किया गया
- तेजी से ईएमए की स्थिति के साथ समापन मूल्य के संबंध के माध्यम से वर्तमान प्रवृत्ति की स्थिति का न्याय करें
- ट्रेडों के निष्पादन के दौरान, सिस्टम स्वचालित रूप से एक निश्चित प्रतिशत के स्टॉप बिड ((4%) और स्टॉप लॉस बिड ((2%) सेट करता है
रणनीतिक लाभ
- बहु-आयामी सिग्नल पुष्टिकरणः ईएमए क्रॉसिंग, फिबोनाची स्तर और प्रवृत्ति की स्थिति के साथ, अधिक विश्वसनीय व्यापारिक संकेत प्रदान करता है
- बेहतर जोखिम प्रबंधनः पूर्वनिर्धारित स्टॉप-स्टॉप-लॉस प्रतिशत के साथ स्वचालित जोखिम नियंत्रण
- प्रवृत्ति ट्रैकिंग क्षमता मजबूतः ईएमए क्रॉसिंग प्रवृत्ति की स्थिति का आकलन करने के लिए, बाजार की प्रवृत्ति को प्रभावी ढंग से पकड़ने के लिए
- स्पष्ट दृश्य प्रतिक्रियाः ट्रेडिंग निर्णयों को आसान बनाने के लिए महत्वपूर्ण मूल्य स्तरों, रुझान की स्थिति और ट्रेडिंग संकेतों को दिखाने वाले टैग
- उच्च स्तर की व्यवस्थितताः लेनदेन तर्क स्पष्ट है, जो व्यक्तिपरक निर्णयों के लिए बाधाओं को कम करता है
रणनीतिक जोखिम
- बाजार में उतार-चढ़ाव का खतराः बार-बार EMA के पार होने से गलत संकेत मिल सकते हैं
- पिछड़ेपन का जोखिमः चलती औसत एक पिछड़ापन है, जो सबसे अच्छा प्रवेश समय से चूक सकता है
- फिक्स्ड स्टॉप लॉस रिस्कः पूर्व निर्धारित फिक्स्ड प्रतिशत स्टॉप लॉस सभी बाजार स्थितियों के लिए उपयुक्त नहीं हो सकता है
- सिग्नल टकराव का जोखिमः कई संकेतकों के बीच विरोधाभासी संकेत हो सकते हैं, जिससे निर्णय लेने में कठिनाई हो सकती है
- बाजार में उतार-चढ़ाव का जोखिमः अत्यधिक उतार-चढ़ाव के कारण स्टॉपलॉस अवांछनीय हो सकता है
रणनीति अनुकूलन दिशा
- गतिशील स्टॉप लॉस ऑप्टिमाइज़ेशनः एटीआर या बाजार में उतार-चढ़ाव के आधार पर स्टॉप लॉस दूरी को गतिशील रूप से समायोजित करना
- सिग्नल फ़िल्टरिंग बढ़ाएँः झूठे संकेतों को फ़िल्टर करने के लिए ट्रैफ़िक, गति और अन्य सहायक संकेतों को बढ़ाएँ
- पैरामीटर अनुकूलनः बाजार की स्थिति के अनुसार गतिशील ईएमए चक्र को समायोजित करने के लिए एक अनुकूलन तंत्र का परिचय
- प्रवेश अनुकूलनः मूल्य पैटर्न और लेन-देन की मात्रा के संयोजन में फिबोनैचि स्तर के आसपास प्रवेश अनुकूलन
- स्थिति प्रबंधन में सुधारः अस्थिरता और खाता जोखिम के आधार पर डिजाइन की गई गतिशील स्थिति प्रबंधन प्रणाली
संक्षेप
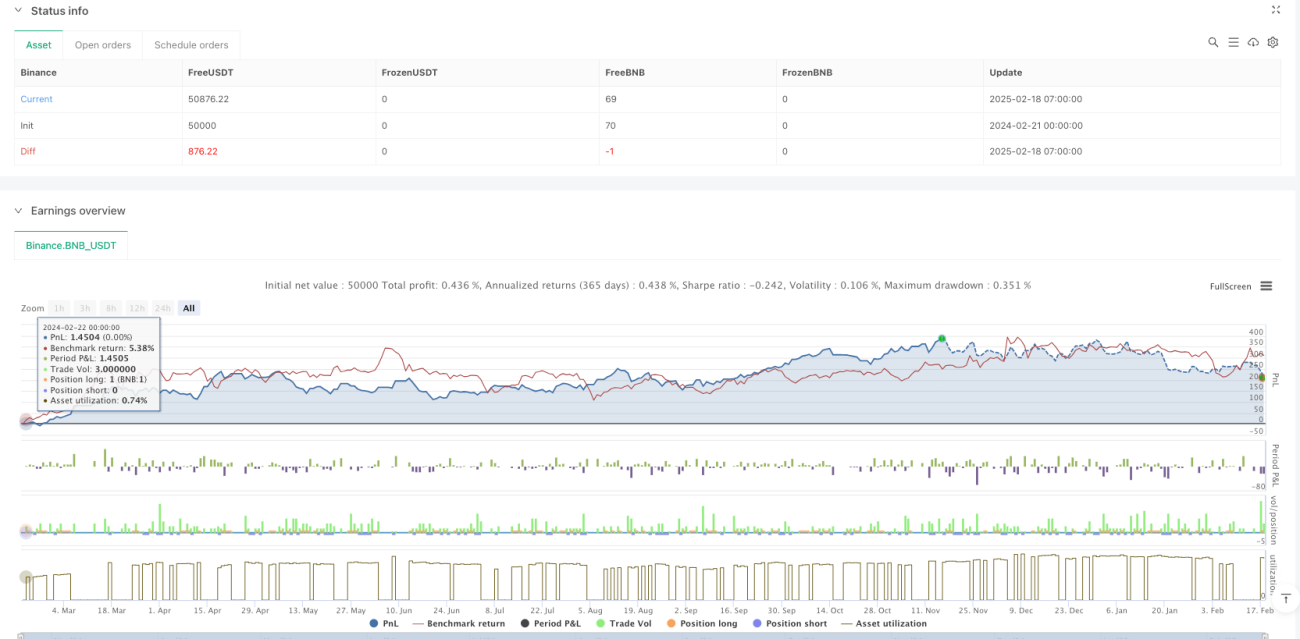
यह रणनीति कई क्लासिक तकनीकी विश्लेषण उपकरणों को एकीकृत करके एक अधिक पूर्ण ट्रेडिंग सिस्टम का निर्माण करती है। इसका लाभ संकेतों की मान्यता की बहुआयामी और जोखिम प्रबंधन की प्रणालीगतता में है, लेकिन अभी भी विभिन्न बाजार स्थितियों के लिए अनुकूलन की आवश्यकता है। व्यापारियों को सलाह दी जाती है कि वे वास्तविक समय में उपयोग किए जाने पर बाजार की विशिष्ट परिस्थितियों के साथ पैरामीटर को अनुकूलित करें और हमेशा जोखिम के प्रति सतर्क रहें।
- 1