
अवलोकन
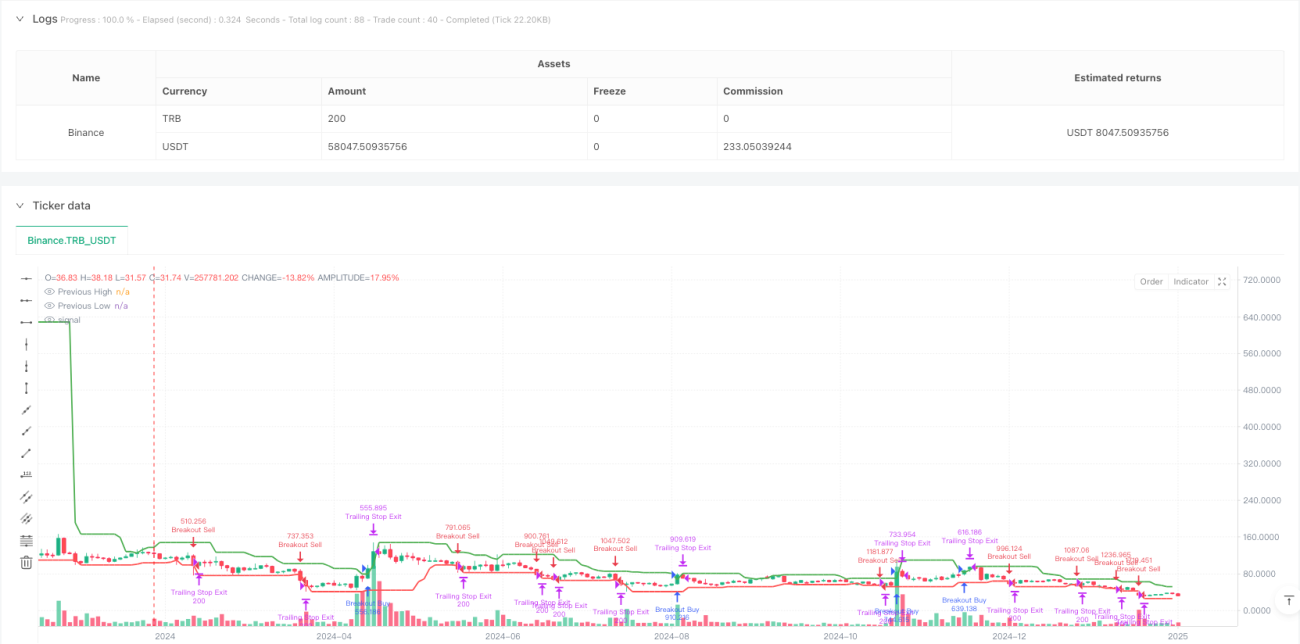
यह रणनीति एक ट्रेडिंग प्रणाली है जो मूल्य के ब्रेकआउट और गतिशील ट्रैकिंग स्टॉपलॉस पर आधारित है। यह पिछले एन चक्रों के उच्चतम और निम्नतम मूल्य की निगरानी करके व्यापार करता है जब कीमत इन महत्वपूर्ण स्तरों को तोड़ती है। रणनीति में एक बुद्धिमान स्टॉपलॉस तंत्र है, जो केवल 1% लाभ के बाद ट्रैक स्टॉपलॉस को सक्रिय करता है, जिससे लाभ को पूरी तरह से विकसित किया जा सकता है। साथ ही 1 घंटे के शीतलन समय को सेट करके ओवर-ट्रेडिंग से बचने के लिए प्रत्येक व्यापार की गुणवत्ता में सुधार करता है।
रणनीति सिद्धांत
रणनीति के मूल तर्क में निम्नलिखित प्रमुख भाग शामिल हैं:
- प्रविष्टि सिग्नलः पिछले एन चक्रों के उच्चतम और निम्नतम मूल्य की गणना करके, जब वर्तमान मूल्य इन स्तरों को तोड़ता है, तो एक व्यापारिक संकेत को ट्रिगर करता है। मल्टीहेड प्रविष्टि के लिए कीमतों को पिछले उच्च स्तर को तोड़ने के लिए एक निश्चित प्रतिशत की आवश्यकता होती है, जबकि खाली सिर को पिछले निम्न स्तर को तोड़ना पड़ता है।
- ट्रेडिंग प्रबंधनः 1 घंटे के ट्रेडिंग शीतलन अवधि को लागू करें, और अत्यधिक उतार-चढ़ाव के दौरान बार-बार व्यापार करने से बचें।
- जोखिम नियंत्रणः गतिशील ट्रैक किए गए स्टॉपलॉस का उपयोग करना, जो केवल 1% लाभ के बाद सक्रिय होता है, लाभ को बेहतर ढंग से संरक्षित करता है।
- पैरामीटर अनुकूलन: महत्वपूर्ण पैरामीटर जैसे कि रिव्यू चक्र, ब्रेक थ्रेशोल्ड, स्टॉप लॉस प्रतिशत आदि को विभिन्न बाजार स्थितियों के अनुसार समायोजित किया जा सकता है।
रणनीतिक लाभ
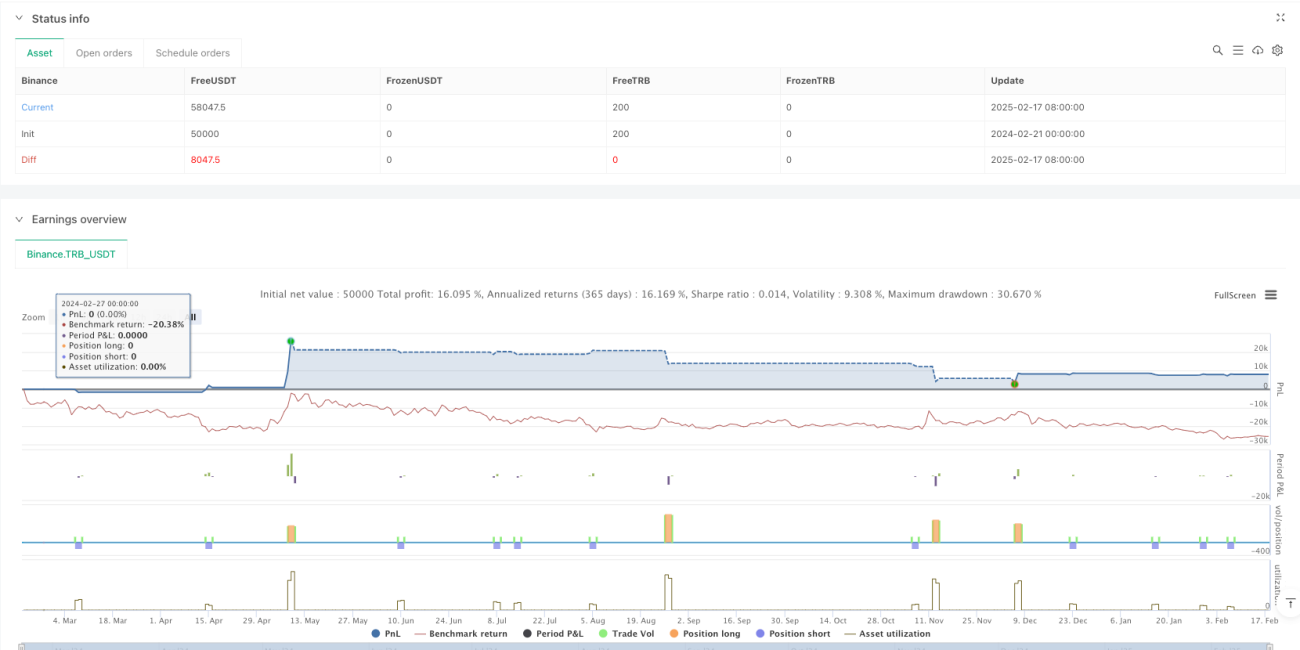
- गतिशील जोखिम प्रबंधनः स्टॉपलॉस को ट्रैक करके, रणनीतियों को मुनाफे की रक्षा करते हुए मुनाफे में निरंतर वृद्धि करने की अनुमति मिलती है।
- लचीला अनुकूली: रणनीति को विभिन्न बाजार स्थितियों के लिए अनुकूलित किया जा सकता है और पैरामीटर को समायोजित करके प्रदर्शन को अनुकूलित किया जा सकता है।
- फ़िल्टरिंग तंत्रः ट्रेडिंग की गुणवत्ता को बेहतर बनाने के लिए, ओवर-ट्रेडिंग से बचने के लिए ट्रेडिंग शीतलन का उपयोग करें।
- सरल और प्रभावीः स्पष्ट रणनीति तर्क, समझने और निष्पादित करने में आसान है, जबकि अच्छी स्केलेबिलिटी को बनाए रखा गया है।
रणनीतिक जोखिम
- झूठी दरार का जोखिमः बाजार में झूठी दरारें हो सकती हैं, जिससे गलत संकेत मिल सकते हैं। लेनदेन की पुष्टि बढ़ाने की सिफारिश की जाती है।
- स्लाइड पॉइंट इफेक्ट्सः उच्च उतार-चढ़ाव के दौरान, स्लाइड पॉइंट्स की संख्या अधिक हो सकती है, जो रणनीति के प्रदर्शन को प्रभावित कर सकती है।
- पैरामीटर संवेदनशीलताः नीति प्रदर्शन पैरामीटर सेटिंग्स के प्रति संवेदनशील है और इसके लिए सावधानीपूर्वक अनुकूलन की आवश्यकता होती है।
- बाजार की स्थिति पर निर्भरता: कम अस्थिरता वाले वातावरण में खराब प्रदर्शन हो सकता है।
रणनीति अनुकूलन दिशा
- लेन-देन के संकेतकों की शुरूआतः लेन-देन की पुष्टि के माध्यम से ब्रेकआउट सिग्नल की विश्वसनीयता में सुधार करना।
- प्रवृत्ति फ़िल्टरिंग जोड़ेंः दीर्घकालिक प्रवृत्ति संकेतकों के साथ, केवल प्रवृत्ति की दिशा में व्यापार करें।
- गतिशील पैरामीटर समायोजनः बाजार में उतार-चढ़ाव के आधार पर ब्रेकआउट और स्टॉप लॉस पैरामीटर को स्वचालित रूप से समायोजित करें।
- मल्टीपल टाइम पीरियडः सटीकता बढ़ाने के लिए कई समय पीरियड के सिग्नल को एकीकृत करना।
संक्षेप
यह एक तर्कसंगत डिजाइन प्रवृत्ति ट्रैकिंग रणनीति है, जो कीमत के ब्रेकआउट और गतिशील स्टॉपलॉस के माध्यम से संयुक्त है, जो बड़े रुझानों को पकड़ने और जोखिम को प्रभावी ढंग से नियंत्रित करने में सक्षम है। रणनीति अनुकूलन योग्य है और पैरामीटर अनुकूलन के माध्यम से विभिन्न बाजार स्थितियों के लिए अनुकूल है। यह सलाह दी जाती है कि एक छोटे से स्थान से शुरू करें और धीरे-धीरे विभिन्न बाजार स्थितियों में रणनीति के प्रदर्शन को सत्यापित करें।
- 1