बहु-स्तरीय ईएमए और आरएसआई गतिशील संभावित ताकत पर आधारित बिटकॉइन क्रॉस-साइकिल ट्रेंड ट्रेडिंग रणनीति

अवलोकन
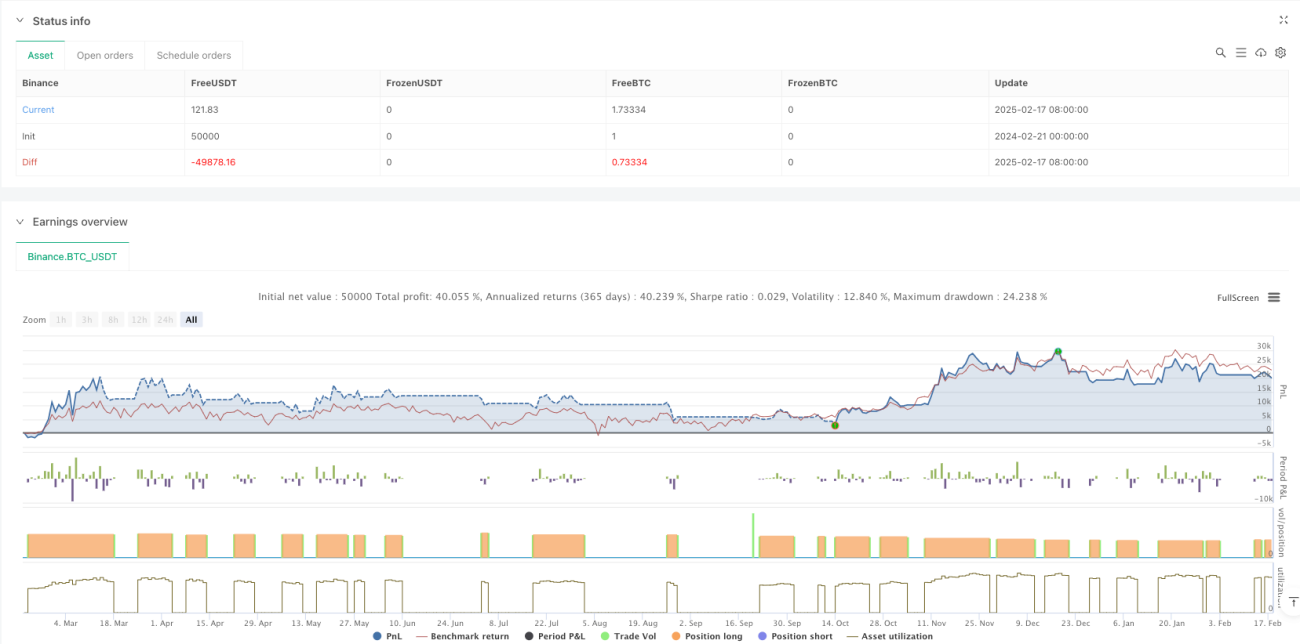
रणनीति एक ट्रेंड ट्रैकिंग ट्रेडिंग सिस्टम है जो क्रॉस-साइक्लोनिक विश्लेषण पर आधारित है, जो बाजार की प्रवृत्ति और गतिशीलता की पहचान करने के लिए ईएमए औसत और आरएसआई संकेतकों के साथ परिधि और दिन-रेखा स्तरों को जोड़ती है। रणनीति ट्रेडिंग अवसरों को पहचानती है और एटीआर-आधारित गतिशील स्टॉपलॉस का उपयोग करके जोखिम का प्रबंधन करती है। प्रणाली एक फंड मैनेजमेंट मॉडल को अपनाती है, जिसमें प्रत्येक ट्रेड के लिए खाते में 100% धन का उपयोग किया जाता है और 0.1% ट्रेडिंग प्रसंस्करण शुल्क पर विचार किया जाता है।
रणनीति सिद्धांत
रणनीति का मूल तर्क निम्नलिखित प्रमुख तत्वों पर आधारित है:
- बाजार की स्थिति को निर्धारित करने के लिए दिन के समापन मूल्य और दिन के समापन ईएमए के संबंध के साथ एक प्रमुख प्रवृत्ति फ़िल्टर के रूप में परिपत्र स्तर पर ईएमए का उपयोग करना
- एटीआर सूचकांक के माध्यम से गतिशील समायोजन के लिए प्रवृत्ति द्वारा निर्धारित थ्रेशोल्ड, रणनीति की अनुकूलनशीलता में वृद्धि
- आरएसआई गतिशीलता को एक अतिरिक्त ट्रेडिंग फ़िल्टर के रूप में शामिल करना
- 7 दिन के न्यूनतम मूल्य और एटीआर पर आधारित ट्रैक स्टॉप सिस्टम का उपयोग करना
- जब अत्यधिक वृद्धि के चेतावनी संकेत होते हैं, तो रणनीति जोखिम से बचने के लिए स्थिति को रोक देती है
रणनीतिक लाभ
- मल्टीपल टाइम फ्रेम एनालिटिक्स एक व्यापक बाजार परिप्रेक्ष्य प्रदान करता है जो नकली सफलताओं को प्रभावी ढंग से फ़िल्टर करता है
- डायनामिक स्टॉप लॉस तंत्र बाजार में उतार-चढ़ाव के अनुकूल है, जो लचीला जोखिम नियंत्रण प्रदान करता है
- आरएसआई गतिशीलता फ़िल्टर प्रवृत्ति की ताकत की पुष्टि करने में मदद करता है और प्रवेश की गुणवत्ता में सुधार करता है
- सिस्टम में अत्यधिक नशे की लत के लिए पूर्व चेतावनी तंत्र शामिल हैं, जो वापसी के जोखिम को टालने में मदद करते हैं
- रणनीति के पैरामीटर को अनुकूलित किया जा सकता है ताकि विभिन्न बाजार स्थितियों के लिए अनुकूलित किया जा सके
रणनीतिक जोखिम
- लेनदेन की लागत में वृद्धि के कारण बाज़ार में बार-बार आने-जाने की संभावना
- 100% फंड के साथ ट्रेडों में उच्च निकासी जोखिम है
- तकनीकी संकेतक पर निर्भरता बाजार की घटनाओं के समय प्रतिक्रिया में देरी कर सकती है
- बहु-समय-फ्रेम विश्लेषण में विभिन्न स्तरों पर विरोधाभासी संकेत हो सकते हैं
- तीव्र उतार-चढ़ाव के दौरान ट्रैक स्टॉप को समय से पहले ट्रिगर किया जा सकता है
रणनीति अनुकूलन दिशा
- कम अस्थिरता के दौरान ट्रेडिंग की आवृत्ति को कम करने के लिए अस्थिरता फ़िल्टर का परिचय
- बाजार की स्थिति के अनुसार गतिशीलता के लिए स्थिति प्रबंधन प्रणाली
- बुनियादी सूचकांकों का एकीकरण, जो अतिरिक्त बाजार परिदृश्य का आकलन प्रदान करता है
- विभिन्न बाजार चरणों के लिए बेहतर रूप से अनुकूलित स्टॉप लॉस ट्रैकिंग पैरामीटर
- ट्रेड वॉल्यूम विश्लेषण के साथ ट्रेंड आकलन की सटीकता
संक्षेप
यह एक पूरी तरह से संरचित, स्पष्ट रूप से तार्किक प्रवृत्ति ट्रैकिंग रणनीति है। यह रणनीति कई समय सीमा विश्लेषण और गतिशील संकेतक फ़िल्टरिंग के माध्यम से प्रमुख रुझानों को बेहतर ढंग से पकड़ने में सक्षम है। हालांकि कुछ अंतर्निहित जोखिम हैं, लेकिन पैरामीटर अनुकूलन और पूरक संकेतक जोड़ने के माध्यम से रणनीति में सुधार के लिए अभी भी बहुत जगह है। यह सलाह दी जाती है कि वास्तविक व्यापार से पहले पर्याप्त फीडबैक किया जाए और विशिष्ट बाजार की स्थिति के अनुसार पैरामीटर सेटिंग्स को समायोजित किया जाए।
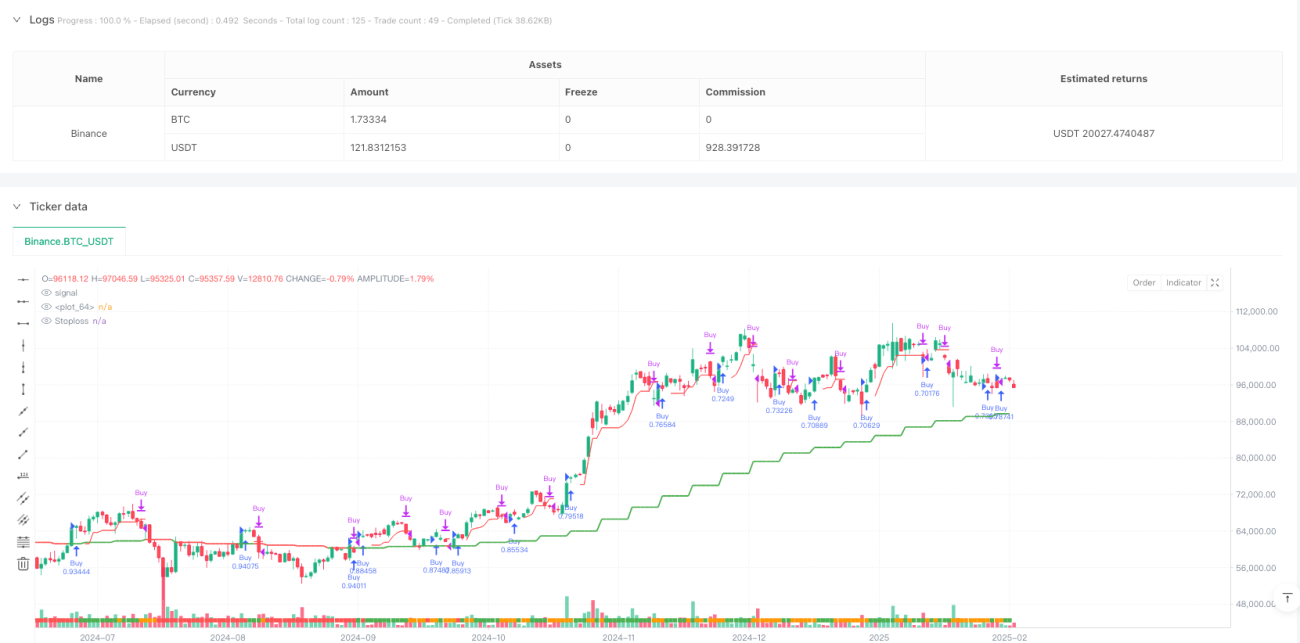
/*backtest
start: 2024-02-21 00:00:00
end: 2025-02-18 08:00:00
period: 1d
basePeriod: 1d
exchanges: [{"eid":"Binance","currency":"BTC_USDT"}]
*/

// @version=6
strategy("Bitcoin Regime Filter Strategy",         // Strategy name
     overlay=true,                                 // The strategy will be drawn directly on the price chart
initial_capital=10000, // Initial capital of 10000 USD- 1