बहु-स्तरीय आरएसआई क्रॉस-रिग्रेशन रणनीति

अवलोकन
यह रणनीति एक स्वचालित ट्रेडिंग प्रणाली है जो अपेक्षाकृत मजबूत सूचक (आरएसआई) पर आधारित है, जो संभावित उछाल के अवसरों को पकड़ने के लिए मुख्य रूप से बाजार की ओवरसोल्ड स्थितियों की पहचान करके है। रणनीति एक प्रगतिशील पोजीशन बिल्डिंग विधि का उपयोग करती है, जो आरएसआई कमियों को पार करने पर कई पोजीशनों को धीरे-धीरे स्थापित करती है, और लाभप्रदता लक्ष्य निर्धारित करके जोखिम नियंत्रण करती है। सिस्टम को एक लचीली धन प्रबंधन तंत्र के लिए डिज़ाइन किया गया है, जो प्रत्येक लेनदेन पर खाते के कुल 6.6% का उपयोग करता है, जो अधिकतम 15 पिरामिड वृद्धि की अनुमति देता है।
रणनीति सिद्धांत
रणनीति का मूल तर्क निम्नलिखित प्रमुख तत्वों पर आधारित है:
- प्रवेश सिग्नलः 14 चक्र आरएसआई के तहत 28.5 के ओवरसोड स्तर को तोड़ने पर एक खरीद संकेत ट्रिगर करता है
- स्थान प्रबंधनः एक बार में 6.6% खाते का उपयोग करने का अधिकार, अधिकतम 15 स्थानों की अनुमति है
- मुनाफा हुआः जब कीमतों में 900% की वृद्धि हुई, तो 50% की होल्डिंग को बंद कर दिया गया
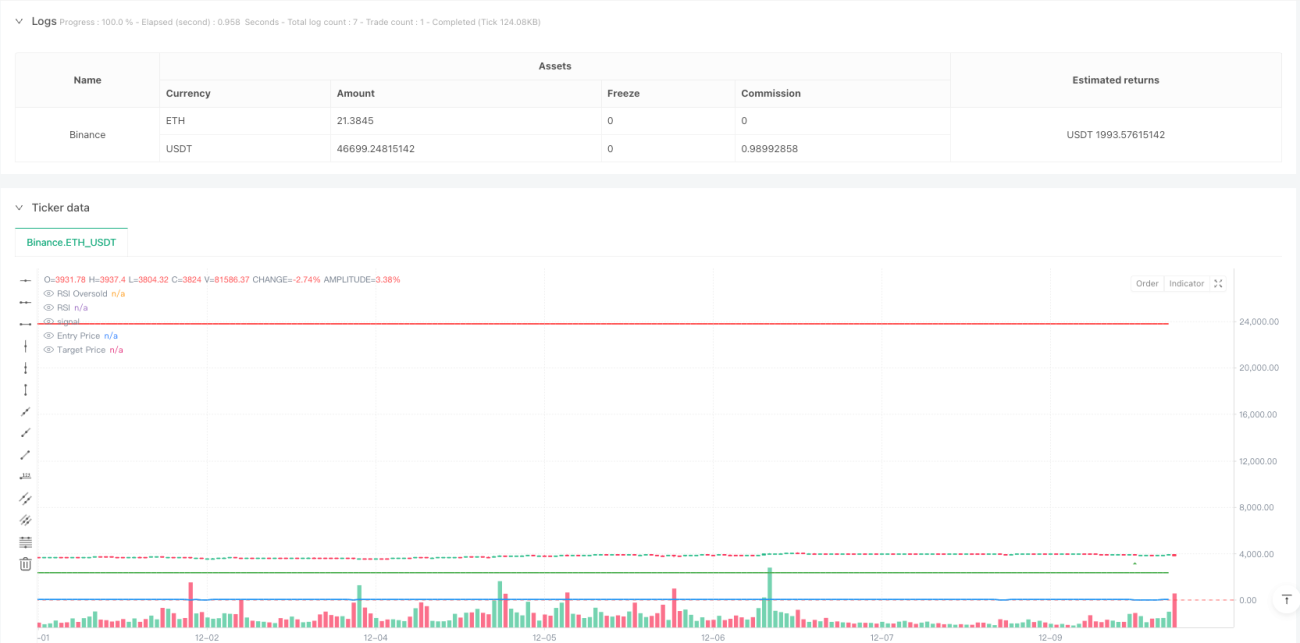
- दृश्य प्रदर्शनः चार्ट पर खरीदारी और बिक्री संकेत, आरएसआई वक्र, प्रवेश मूल्य और लक्ष्य मूल्य चिह्नित करें
रणनीति ओवरसोल्ड क्षेत्र में आरएसआई के प्रदर्शन को देखते हुए बाजार के रुझान का आकलन करने के लिए, ओवरसोल्ड सिग्नल आने पर स्टॉक बनाने की लागत को कम करने के लिए धीरे-धीरे स्टॉक बनाने की रणनीति।
रणनीतिक लाभ
- व्यवस्थित पोजीशन बिल्डिंगः पूर्व-निर्धारित आरएसआई पैरामीटर के माध्यम से व्यापार के अवसरों की स्वचालित पहचान करना, मानव निर्णय के कारण होने वाले व्यक्तिपरक विचलन से बचना
- जोखिम फैलावः एक क्रमिक स्टॉक बिल्डिंग विधि का उपयोग करके, विभिन्न कीमतों पर कई पदों का निर्माण, जोखिम को प्रभावी ढंग से फैलाता है
- लचीलापनः विभिन्न बाजार स्थितियों और व्यक्तिगत जोखिम वरीयताओं के अनुसार रणनीति पैरामीटर को समायोजित किया जा सकता है
- लाभ संरक्षणः एक स्पष्ट लाभ लक्ष्य निर्धारित किया गया है, लक्ष्य पर पहुंचने पर स्वचालित रूप से कम हो जाता है, लाभ के कुछ हिस्सों को बंद कर देता है
- पूंजी दक्षता: उचित स्थिति नियंत्रण और अधिभार तंत्र के माध्यम से पूंजी के उपयोग की दक्षता में सुधार
रणनीतिक जोखिम
- रुझान जोखिमः मजबूत गिरावट के दौरान अक्सर स्टॉक बनाने के संकेतों को ट्रिगर किया जा सकता है, जिससे धन की हानि होती है
- पैरामीटर संवेदनशीलः आरएसआई पैरामीटर, स्थिति निर्माण अनुपात आदि की गलत सेटिंग्स रणनीति के प्रदर्शन को प्रभावित कर सकती हैं
- बाजार की तरलताः कम तरलता वाले बाजारों में, लक्ष्य मूल्य पर लेनदेन करना मुश्किल हो सकता है
- फंड मैनेजमेंटः अत्यधिक पूंजीकरण से जोखिम के लिए बहुत अधिक अवसर पैदा हो सकते हैं
समाधान:
- प्रवृत्ति फ़िल्टर जोड़ें, स्पष्ट गिरावट के दौरान गोदामों का निर्माण रोकें
- फीडबैक के माध्यम से अनुकूलित पैरामीटर सेट करें
- अधिकतम निकासी सीमा सेट करें
- गतिशील समायोजन
रणनीति अनुकूलन दिशा
- गतिशील पैरामीटरः बाजार में उतार-चढ़ाव के आधार पर आरएसआई पैरामीटर और स्थिति बनाने की शर्तों को स्वचालित रूप से समायोजित करना
- स्टॉप लॉस मैकेनिज्मः मोबाइल स्टॉप लॉस फीचर को बढ़ाकर जोखिम को बेहतर तरीके से नियंत्रित किया जा सकता है
- बाज़ार फ़िल्टरिंगः सिग्नल की गुणवत्ता में सुधार के लिए लेन-देन की मात्रा, रुझान आदि जैसे फ़िल्टरिंग शर्तें जोड़ें
- आउट-ऑफ-पेज ऑप्टिमाइज़ेशनः अधिक लचीले लाभ-बंद तंत्रों को डिजाइन करना, जैसे कि चरणबद्ध कटौती
- जोखिम नियंत्रणः अधिकतम निकासी सीमा और जोखिम छेद नियंत्रण बढ़ाएं
संक्षेप
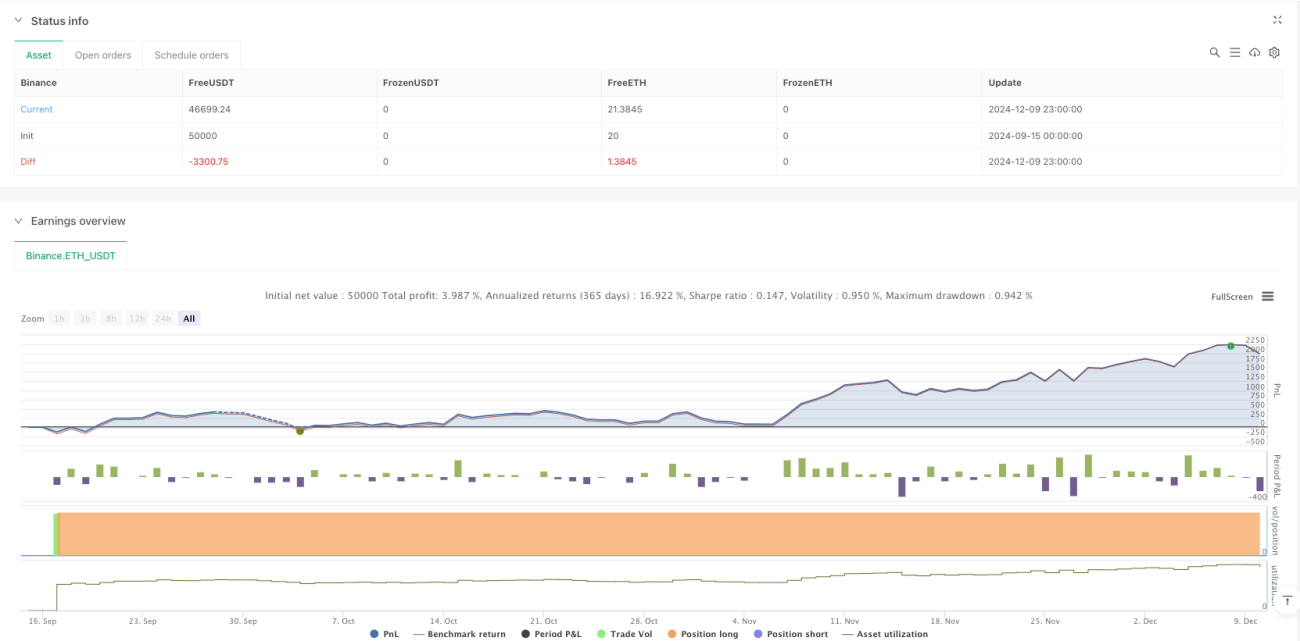
इस रणनीति ने ओवरसोल्ड अवसरों की पहचान आरएसआई संकेतक के माध्यम से की, पिरामिड-आधारित बढ़ोतरी और निश्चित अनुपात के साथ लाभान्वित किया, और एक पूर्ण व्यापार प्रणाली का निर्माण किया। रणनीति का लाभ व्यवस्थित संचालन और जोखिम वितरण में है, लेकिन रणनीति के प्रदर्शन पर बाजार की प्रवृत्ति और पैरामीटर सेटिंग के प्रभाव पर ध्यान देने की आवश्यकता है। गतिशील पैरामीटर समायोजन, स्टॉप-लॉस तंत्र और बाजार फ़िल्टरिंग जैसे अनुकूलन उपायों को जोड़कर रणनीति की स्थिरता और लाभप्रदता को और बढ़ाया जा सकता है।
/*backtest
start: 2024-09-15 00:00:00
end: 2024-12-10 00:00:00
period: 1h
basePeriod: 1h
exchanges: [{"eid":"Binance","currency":"ETH_USDT"}]
*/

//@version=5
strategy("RSI Cross Under Strategy", overlay=true, initial_capital=1500, default_qty_type=strategy.percent_of_equity, default_qty_value=6.6)

// Input parameters- 1