नादराया-वॉटसन पर आधारित बहुआयामी एकीकृत व्यापार रणनीति

SMA RSI ATR
निर्माण तिथि: 2025-02-20 17:38:44 अंत में संशोधित करें: 2025-02-27 17:21:26
कॉपी: 0 क्लिक्स: 446
2
ध्यान केंद्रित करना
319
समर्थक

नादराया-वॉटसन पर आधारित बहुआयामी एकीकृत व्यापार रणनीति नादराया-वॉटसन पर आधारित बहुआयामी एकीकृत व्यापार रणनीति

अवलोकन

यह रणनीति एक बहुआयामी ट्रेडिंग प्रणाली है जो नाडाराया-वाटसन कोर रिग्रेशन पर आधारित है, जो चार आयामों के तकनीकी, भावनात्मक, अतिसंवेदनशील और इरादे की बाजार जानकारी को एकीकृत करके व्यापारिक निर्णयों को निर्देशित करने के लिए एक समग्र संकेत बनाता है। रणनीति भार-अनुकूलन विधि का उपयोग करती है, विभिन्न आयामों के संकेतों को भारित करती है, और संकेत की गुणवत्ता को बढ़ाने के लिए प्रवृत्ति और गतिशीलता फ़िल्टर के साथ संयुक्त होती है। सिस्टम में पूर्ण जोखिम प्रबंधन मॉड्यूल भी शामिल हैं, जो स्टॉप-लॉस और स्टॉप-स्टॉप के माध्यम से धन की सुरक्षा के लिए सुरक्षित है।

रणनीति सिद्धांत

इस रणनीति का मुख्य उद्देश्य नाडाराया-वाटसन न्यूक्लियर रिग्रेशन के माध्यम से बहु-आयामी बाजार डेटा को चिकना करना है। विशेष रूप सेः

  1. तकनीकी आयाम का उपयोग समापन मूल्य
  2. भावनात्मक आयाम आरएसआई का उपयोग करते हुए
  3. अतिसंवेदनशील आयामों में एटीआर तरंग दर
  4. मूल्य और औसत से विचलन 
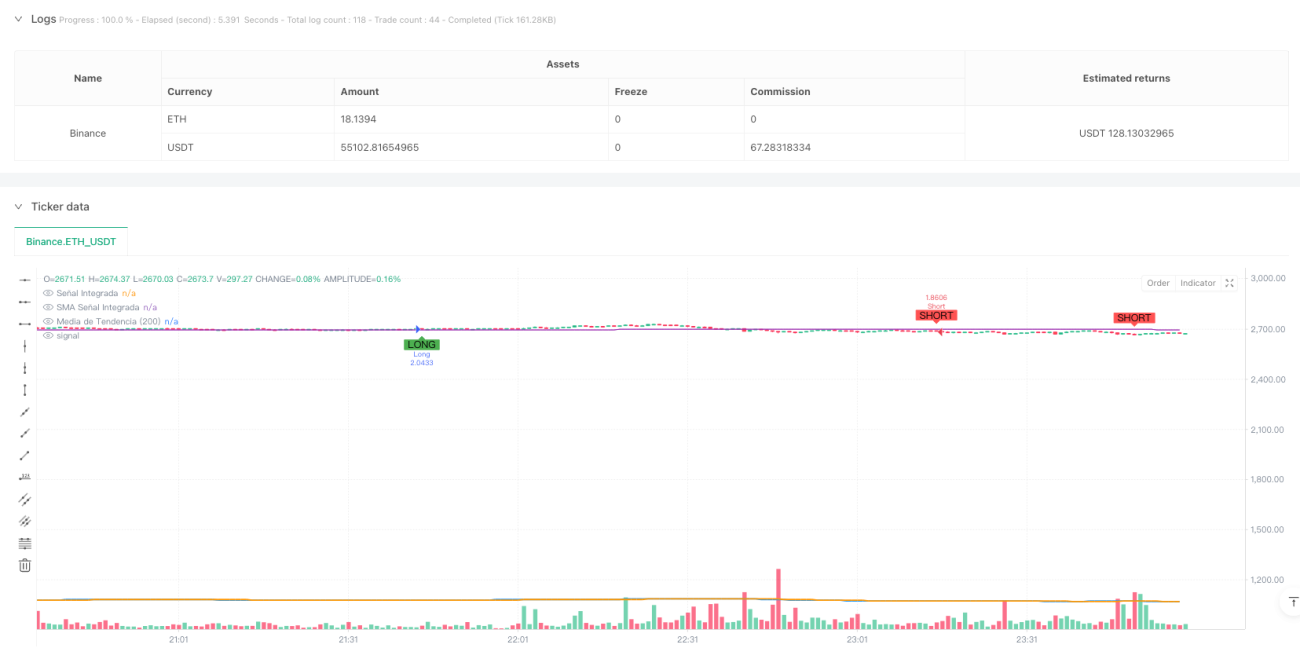
इन आयामों के बाद, पूर्वनिर्धारित भारों के माध्यम से भारित एकीकरण किया जाता है (तकनीकी 0.4, भावनात्मक 0.2, अतिसंवेदनशीलता 0.2, इरादा 0.2) और एक अंतिम व्यापारिक संकेत का गठन किया जाता है। जब एकीकरण संकेत और इसकी चलती औसत के बीच एक चौराहा होता है, तो ट्रेडिंग निर्देश जारी किया जाता है, जिसमें प्रवृत्ति और गतिशीलता फ़िल्टर की पुष्टि होती है।

रणनीतिक लाभ

  1. बहुआयामी विश्लेषण एक एकल सूचकांक की सीमाओं से बचने के लिए एक व्यापक बाजार परिप्रेक्ष्य प्रदान करता है
  2. Nadaraya-Watson Nuclear Regression प्रभावी रूप से बाजार के शोर को कम करता है और एक चिकनी संकेत प्रदान करता है
  3. वजन अनुकूलन तंत्र बाजार विशेषताओं के अनुसार आयामों के महत्व को समायोजित करने की अनुमति देता है
  4. प्रवृत्ति और गतिशीलता फ़िल्टर के अलावा सिग्नल की गुणवत्ता में काफी सुधार हुआ है
  5. अच्छी तरह से प्रबंधित जोखिम प्रणाली धन की सुरक्षा सुनिश्चित करती है

रणनीतिक जोखिम

  1. अत्यधिक पैरामीटर अनुकूलन से ओवरफिटिंग हो सकती है
  2. बहु-फ़िल्टरिंग शर्तों के लिए कुछ संकेतों को याद किया जा सकता है
  3. उच्च जटिलता के साथ न्यूक्लियर रिग्रेशन, वास्तविक समय प्रदर्शन को प्रभावित कर सकता है
  4. गलत भार वितरण से कुछ महत्वपूर्ण बाजार संकेत कमजोर हो सकते हैं इसमें शामिल हैं: आउट-ऑफ-नमूना परीक्षण सत्यापन पैरामीटर का उपयोग करना, फ़िल्टरिंग स्थितियों को गतिशील रूप से समायोजित करना, गणना दक्षता का अनुकूलन करना, समय-समय पर मूल्यांकन करना और वजन वितरण को समायोजित करना।

रणनीति अनुकूलन दिशा

  1. बाजार की गतिशीलता के अनुसार आयामों के वजन को समायोजित करने के लिए एक अनुकूलन भार प्रणाली की शुरूआत
  2. सिग्नल की गुणवत्ता और मात्रा को संतुलित करने के लिए अधिक बुद्धिमान फ़िल्टरिंग तंत्र विकसित करना
  3. Nadaraya-Watson एल्गोरिथ्म को अनुकूलित करें और गणना की दक्षता में सुधार करें
  4. विभिन्न बाजार चरणों में विभिन्न पैरामीटर सेटिंग्स के साथ एक बाजार चक्र पहचान मॉड्यूल जोड़ें
  5. जोखिम प्रबंधन प्रणाली का विस्तार, गतिशील स्टॉपलॉस और पोजीशन प्रबंधन सुविधाओं को जोड़ना

संक्षेप

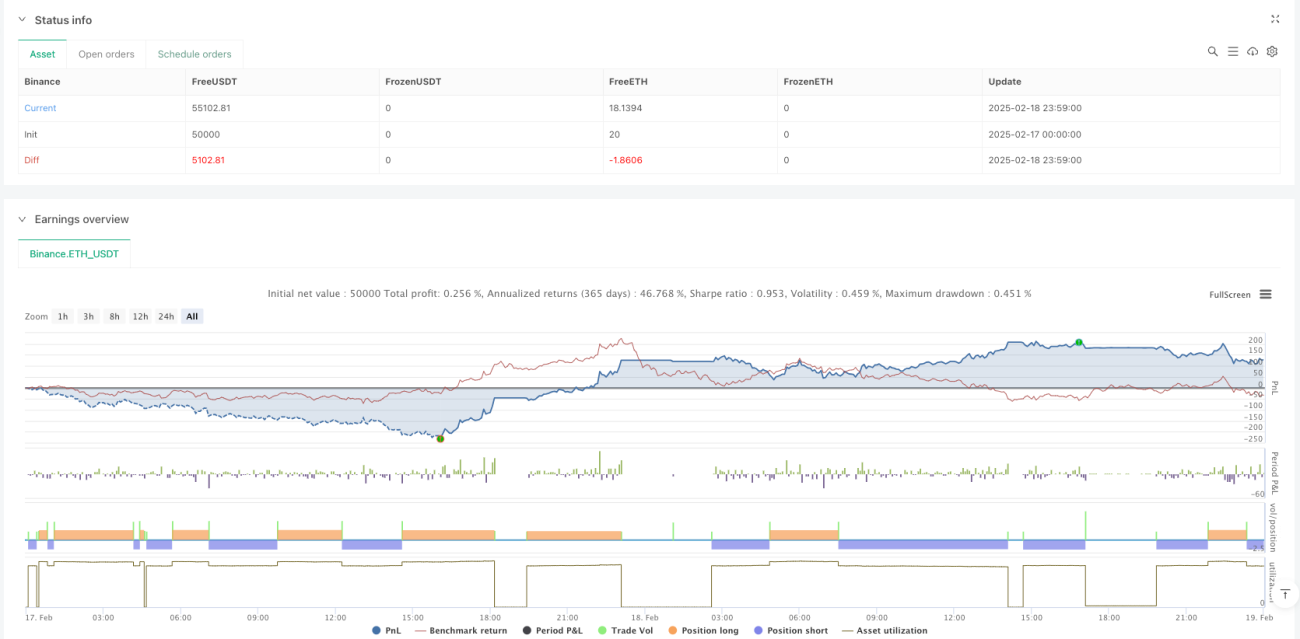
यह एक अभिनव रणनीति है जो गणित के तरीकों को व्यापारिक बुद्धिमत्ता के साथ जोड़ती है। बहु-आयामी विश्लेषण और उन्नत गणितीय उपकरणों के माध्यम से, रणनीति बाजार के कई स्तरों को पकड़ने में सक्षम है और अपेक्षाकृत विश्वसनीय व्यापारिक संकेत प्रदान करती है। हालांकि कुछ अनुकूलन के लिए जगह है, रणनीति का समग्र ढांचा मजबूत है और व्यावहारिक अनुप्रयोग मूल्य के साथ है।

रणनीति स्रोत कोड
/*backtest
start: 2025-02-17 00:00:00
end: 2025-02-19 00:00:00
period: 1m
basePeriod: 1m
exchanges: [{"eid":"Binance","currency":"ETH_USDT"}]
*/

//@version=5
strategy("Enhanced Multidimensional Integration Strategy with Nadaraya", overlay=true, initial_capital=10000, currency=currency.USD, default_qty_type=strategy.percent_of_equity, default_qty_value=10)

//────────────────────────────────────────────────────────────────────────────
// 1. Configuration and Weight Optimization Parameters
//────────────────────────────────────────────────────────────────────────────
// Weights can be optimized to favor dimensions with higher historical correlation.
// Base values are maintained but can be fine-tuned.
w_technical   = input.float(0.4,   "Technical Weight",        step=0.05)
w_emotional   = input.float(0.2,   "Emotional Weight",      step=0.05)
w_extrasensor = input.float(0.2,   "Extrasensory Weight", step=0.05)
w_intentional = input.float(0.2,   "Intentional Weight",    step=0.05)

// Parameters for Nadaraya-Watson Smoothing Function:
// Smoothing period and bandwidth affect the "memory" and sensitivity of the signal.
smooth_length = input.int(20, "Smoothing Period", minval=5)
bw_param      = input.float(20, "Bandwidth", minval=1, step=1)

//────────────────────────────────────────────────────────────────────────────
// 2. Risk Management Parameters
//────────────────────────────────────────────────────────────────────────────
// Incorporate stop-loss and take-profit in percentage to protect capital.
// These parameters can be optimized through historical testing.
stopLossPerc   = input.float(1.5, "Stop Loss (%)", step=0.1) / 100   // 1.5% stop-loss
takeProfitPerc = input.float(3.0, "Take Profit (%)", step=0.1) / 100   // 3.0% take-profit

//────────────────────────────────────────────────────────────────────────────
// 3. Additional Filters (Trend and Momentum)
//────────────────────────────────────────────────────────────────────────────
// A long-term moving average is used to confirm the overall trend direction.
trend_length = input.int(200, "Trend MA Period", minval=50)
// RSI is used to confirm momentum. A level of 50 is common to distinguish bullish and bearish phases.
rsi_filter_level = input.int(50, "RSI Confirmation Level", minval=30, maxval=70)

//────────────────────────────────────────────────────────────────────────────
// 4. Definition of Dimensions
//────────────────────────────────────────────────────────────────────────────
tech_series         = close
emotional_series    = ta.rsi(close, 14) / 100
extrasensorial_series = ta.atr(14) / close
intentional_series  = (close - ta.sma(close, 50)) / close

//────────────────────────────────────────────────────────────────────────────
// 5. Nadaraya-Watson Smoothing Function
//────────────────────────────────────────────────────────────────────────────
// This function smooths each dimension using a Gaussian kernel.
// Proper smoothing reduces noise and helps obtain a more robust signal.
nadaraya_smooth(_src, _len, _bw) =>
    if bar_index < _len
        na
    else
        float sumW  = 0.0
        float sumWY = 0.0
        for i = 0 to _len - 1
            weight = math.exp(-0.5 * math.pow(((_len - 1 - i) / _bw), 2))
            sumW  := sumW + weight
            sumWY := sumWY + weight * _src[i]
        sumWY / sumW

//────────────────────────────────────────────────────────────────────────────
// 6. Apply Smoothing to Each Dimension
//────────────────────────────────────────────────────────────────────────────
sm_tech        = nadaraya_smooth(tech_series, smooth_length, bw_param)
sm_emotional   = nadaraya_smooth(emotional_series, smooth_length, bw_param)
sm_extrasens   = nadaraya_smooth(extrasensorial_series, smooth_length, bw_param)
sm_intentional = nadaraya_smooth(intentional_series, smooth_length, bw_param)

//────────────────────────────────────────────────────────────────────────────
// 7. Integration of Dimensions
//────────────────────────────────────────────────────────────────────────────
// The integrated signal is composed of the weighted sum of each smoothed dimension.
// This multidimensional approach seeks to capture different aspects of market behavior.
integrated_signal = (w_technical * sm_tech) + (w_emotional * sm_emotional) + (w_extrasensor * sm_extrasens) + (w_intentional * sm_intentional)
// Additional smoothing of the integrated signal to obtain a reference line.
sma_integrated = ta.sma(integrated_signal, 10)

//────────────────────────────────────────────────────────────────────────────
// 8. Additional Filters to Improve Accuracy and Win Rate
//────────────────────────────────────────────────────────────────────────────
// Trend filter: only trade in the direction of the overall trend, determined by a 200-period SMA.
trendMA = ta.sma(close, trend_length)
// Momentum filter: RSI is used to confirm the strength of the movement (RSI > 50 for long and RSI < 50 for short).
rsi_val = ta.rsi(close, 14)

longFilter  = (close > trendMA) and (rsi_val > rsi_filter_level)
shortFilter = (close < trendMA) and (rsi_val < rsi_filter_level)

// Crossover signals of the integrated signal with its SMA reference.
rawLongSignal  = ta.crossover(integrated_signal, sma_integrated)
rawShortSignal = ta.crossunder(integrated_signal, sma_integrated)
// Incorporate trend and momentum filters to filter false signals.
longSignal  = rawLongSignal and longFilter
shortSignal = rawShortSignal and shortFilter

//────────────────────────────────────────────────────────────────────────────
// 9. Risk Management and Order Generation
//────────────────────────────────────────────────────────────────────────────
// Entries are made based on the filtered integrated signal.
if longSignal
    strategy.entry("Long", strategy.long, comment="Long Entry")
if shortSignal
    strategy.entry("Short", strategy.short, comment="Short Entry")

// Add automatic exits using stop-loss and take-profit to limit losses and secure profits.
// For long positions: stop-loss below entry price and take-profit above.
if strategy.position_size > 0
    strategy.exit("Exit Long", "Long", stop = strategy.position_avg_price * (1 - stopLossPerc), limit = strategy.position_avg_price * (1 + takeProfitPerc))
// For short positions: stop-loss above entry price and take-profit below.
if strategy.position_size < 0
    strategy.exit("Exit Short", "Short", stop = strategy.position_avg_price * (1 + stopLossPerc), limit = strategy.position_avg_price * (1 - takeProfitPerc))

//────────────────────────────────────────────────────────────────────────────
// 10. Visualization on the Chart
//────────────────────────────────────────────────────────────────────────────
plot(integrated_signal, color=color.blue, title="Integrated Signal", linewidth=2)
plot(sma_integrated,      color=color.orange, title="SMA Integrated Signal", linewidth=2)
plot(trendMA,           color=color.purple, title="Trend MA (200)", linewidth=1, style=plot.style_line)
plotshape(longSignal,  title="Long Signal",  location=location.belowbar, color=color.green, style=shape.labelup,   text="LONG")
plotshape(shortSignal, title="Short Signal",  location=location.abovebar, color=color.red,   style=shape.labeldown, text="SHORT")