बहु-संकेतक एकीकरण अनुकूली प्रवृत्ति व्यापार रणनीति

अवलोकन
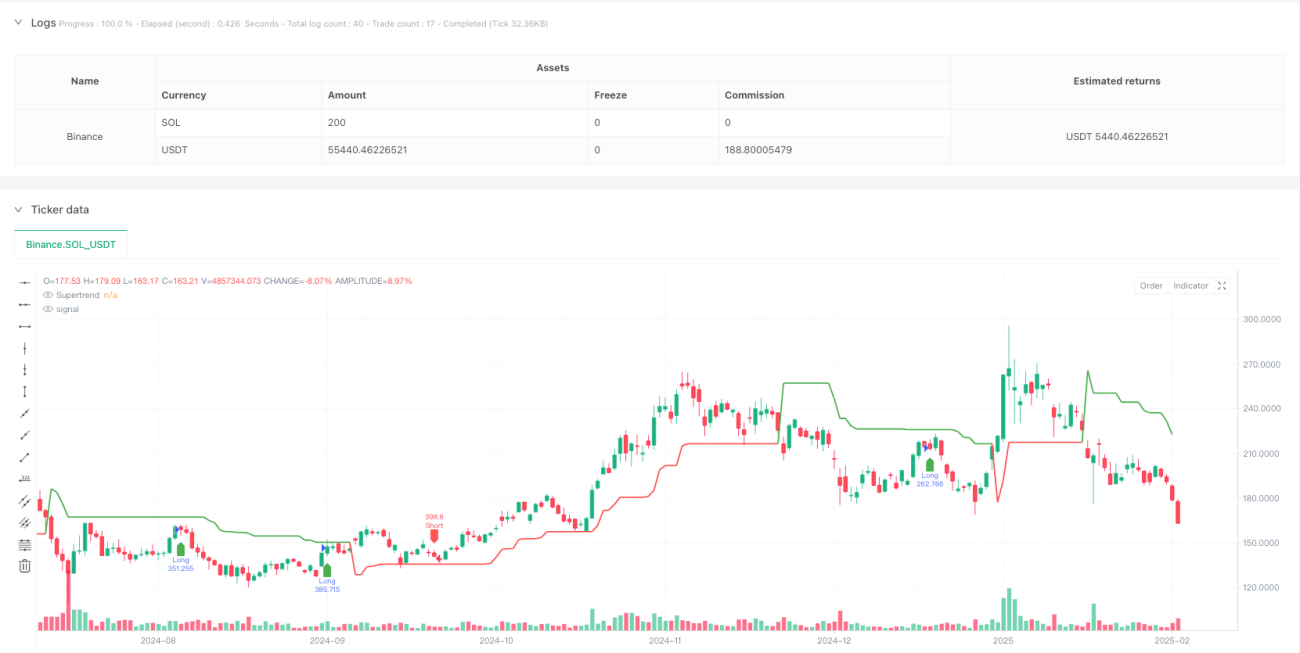
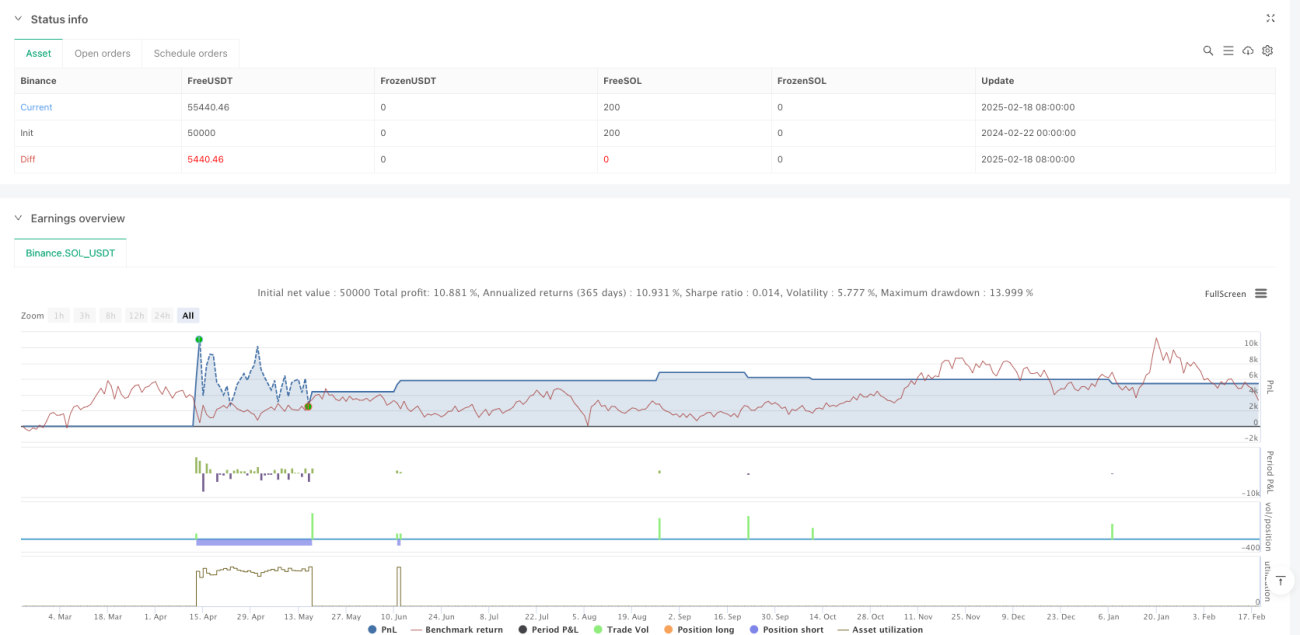
यह रणनीति एक अनुकूली प्रवृत्ति-अनुसरण व्यापार प्रणाली है जो कई तकनीकी संकेतकों को एकीकृत करती है। यह मूविंग एवरेज सिस्टम (EMA), मोमेंटम इंडिकेटर (RSI), ट्रेंड इंडिकेटर (MACD) और SuperTrend को सिग्नल पुष्टि के लिए जोड़ती है, साथ ही इसमें स्टॉप-लॉस, टेक-प्रॉफिट और ट्रेलिंग स्टॉप जैसे पूर्ण जोखिम प्रबंधन तंत्र शामिल हैं। रणनीति बाजार की अस्थिरता को ध्यान में रखते हुए डिज़ाइन की गई है, और कई सिग्नल फ़िल्टर और जोखिम नियंत्रण के माध्यम से व्यापार की स्थिरता और विश्वसनीयता में सुधार करती है।
रणनीति सिद्धांत
रणनीति बहु-स्तरीय सिग्नल पुष्टि तंत्र का उपयोग करती है:
- 9-अवधि और 21-अवधि EMA के क्रॉसओवर के माध्यम से प्रारंभिक प्रवृत्ति दिशा निर्धारित करना
- अति-खरीद और अति-बिक्री फ़िल्टरिंग के लिए RSI (14) का उपयोग; खरीद सिग्नल के लिए RSI > 40 और < 70 आवश्यक, बिक्री सिग्नल के लिए RSI < 60 और > 30 आवश्यक
- MACD संकेतक प्रवृत्ति गति की पुष्टि करता है, जिसमें सिग्नल लाइन और MACD लाइन की दिशा समान होनी चाहिए
- SuperTrend संकेतक अतिरिक्त प्रवृत्ति पुष्टि प्रदान करता है
- जोखिम नियंत्रण में 5% स्टॉप-लॉस, 10% टेक-प्रॉफिट, 2% ट्रेलिंग स्टॉप और 1% ब्रेक-ईवन पॉइंट शामिल हैं
व्यापार सिग्नल तभी ट्रिगर होता है जब सभी शर्तें एक साथ पूरी होती हैं, जिससे झूठे ब्रेकआउट का जोखिम प्रभावी रूप से कम हो जाता है।
रणनीति के लाभ
- बहु-सिग्नल पुष्टि तंत्र झूठे सिग्नल हस्तक्षेप को काफी कम करता है
- पूर्ण जोखिम नियंत्रण प्रणाली, जिसमें फिक्स्ड स्टॉप-लॉस, ट्रेलिंग स्टॉप और ब्रेक-ईवन स्टॉप शामिल हैं
- रणनीति में अच्छी अनुकूलनशीलता है, जो विभिन्न बाजार वातावरणों के अनुकूल हो सकती है
- प्रवेश और निकास तर्क स्पष्ट है, समझने और बनाए रखने में आसान है
- व्यापार तर्क का एक ठोस सैद्धांतिक आधार है, प्रत्येक संकेतक का अपना विशिष्ट कार्य है
रणनीति जोखिम
- बहु-सिग्नल पुष्टि के कारण कुछ महत्वपूर्ण व्यापार अवसर छूट सकते हैं
- अत्यधिक अस्थिर बाजारों में, निश्चित स्टॉप-लॉस स्तर पर्याप्त लचीले नहीं हो सकते
- पैरामीटर अनुकूलन ऐतिहासिक डेटा में ओवरफ़िटिंग का कारण बन सकता है
- साइडवेज़ बाजार में कई संकेतक भ्रमित करने वाले सिग्नल उत्पन्न कर सकते हैं
समाधान में शामिल हैं: स्टॉप-लॉस पैरामीटर को गतिशील रूप से समायोजित करना, अस्थिरता संकेतक शामिल करना, नियमित रूप से पैरामीटर को फिर से अनुकूलित करना आदि।
रणनीति अनुकूलन दिशाएँ
- अनुकूली पैरामीटर तंत्र शुरू करना, बाजार की अस्थिरता के अनुसार विभिन्न मापदंडों को गतिशील रूप से समायोजित करना
- सहायक पुष्टि उपकरण के रूप में वॉल्यूम संकेतक जोड़ना
- स्टॉप-लॉस तंत्र को अनुकूलित करना, ATR-आधारित गतिशील स्टॉप-लॉस शामिल करना
- बाजार वातावरण पहचान मॉड्यूल जोड़ना, विभिन्न बाजार स्थितियों में विभिन्न पैरामीटर संयोजनों का उपयोग करना
- मशीन लर्निंग-आधारित पैरामीटर अनुकूलन प्रणाली विकसित करना
सारांश
यह रणनीति बहु-आयामी तकनीकी संकेतकों के समन्वय के माध्यम से एक मजबूत व्यापार प्रणाली का निर्माण करती है। पूर्ण जोखिम नियंत्रण तंत्र और स्पष्ट व्यापार तर्क इसे अच्छी व्यावहारिकता प्रदान करते हैं। हालाँकि अनुकूलन की गुंजाइश है, रणनीति के मूल ढाँचे का एक ठोस सैद्धांतिक आधार है, और निरंतर अनुकूलन और सुधार के माध्यम से, इसके व्यापार प्रदर्शन को और बढ़ाने की उम्मीद है।
/*backtest
start: 2024-02-22 00:00:00
end: 2025-02-19 08:00:00
period: 1d
basePeriod: 1d
exchanges: [{"eid":"Binance","currency":"SOL_USDT"}]
*/

//@version=5
strategy("Optimized BTC Trading Strategy v2", overlay=true, default_qty_type=strategy.percent_of_equity, default_qty_value=100, commission_type=strategy.commission.percent, commission_value=0.1)

// Input parameters- 1