
अवलोकन
यह रणनीति एक डोनचियन चैनल ब्रेकआउट पर आधारित ट्रेंड ट्रैकिंग ट्रेडिंग सिस्टम है, जो सुपरट्रेंड इंडिकेटर और ट्रेड वॉल्यूम फिल्टर के साथ मिलकर ट्रेडिंग सिग्नल की विश्वसनीयता को बढ़ाता है। यह रणनीति मुख्य रूप से संभावित मल्टीहेड ट्रेडिंग अवसरों की पहचान करने के लिए मूल्य के ऐतिहासिक उच्च स्तर को तोड़ने के तरीके को पकड़ती है, जबकि नकली ब्रेकआउट सिग्नल को फ़िल्टर करने के लिए ट्रेड वॉल्यूम की पुष्टि और ट्रेंड ट्रैकिंग इंडिकेटर का उपयोग करती है। रणनीति को लचीला बनाया गया है और विभिन्न बाजार स्थितियों और ट्रेडिंग किस्मों के अनुसार पैरामीटर को अनुकूलित किया जा सकता है।
रणनीति सिद्धांत
रणनीति का मूल तर्क निम्नलिखित प्रमुख घटकों पर आधारित है:
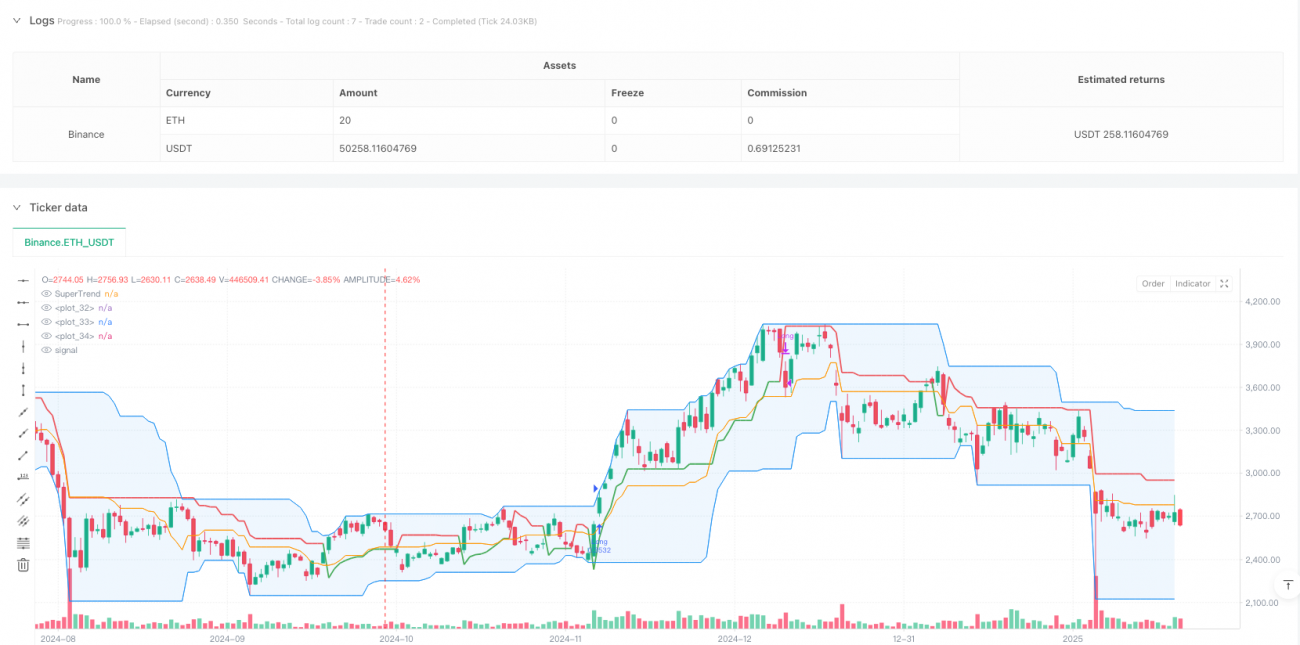
- डोंगचीआन चैनलः उपयोगकर्ता द्वारा परिभाषित चक्र के भीतर उच्चतम और निम्नतम मूल्य की गणना करें, अपररेल, डाउनरेल और मिडरेल बनाएं। जब कीमत अपररेल को तोड़ती है, तो मल्टीहेड एंट्री सिग्नल ट्रिगर करें।
- लेन-देन फ़िल्टरः लेन-देन की वर्तमान मात्रा की तुलना 20 चक्रों की चलती औसत के साथ करके, यह सुनिश्चित करें कि लेन-देन की मात्रा बढ़े जाने पर ही प्रवेश किया जाए, जिससे ब्रेक की विश्वसनीयता बढ़ जाए।
- सुपर ट्रेंड इंडिकेटरः एक ट्रेंड कन्फर्मेशन टूल के रूप में, यह मल्टीहेड ट्रेंड के लिए हरे रंग में प्रदर्शित होता है, जबकि एक खाली ट्रेंड के लिए लाल रंग में प्रदर्शित होता है।
- लचीली रोकथाम तंत्रः चार अलग-अलग रोकथाम विकल्प प्रदान करता है, जिसमें निम्न-रेखा रोकथाम, मध्य-रेखा रोकथाम, सुपरट्रेंड रोकथाम और प्रतिशत ट्रैक रोकथाम शामिल हैं।
रणनीतिक लाभ
- मल्टी सिग्नल कन्फर्मेशनः मूल्य ब्रेकआउट, लेनदेन की पुष्टि और प्रवृत्ति संकेतकों के संयोजन से, झूठे ब्रेकआउट के जोखिम को काफी कम किया जाता है।
- अनुकूलनशीलता: विभिन्न बाजार स्थितियों और ट्रेडिंग चक्रों के लिए पैरामीटर के समायोजन के माध्यम से अनुकूलित किया जा सकता है
- जोखिम प्रबंधन में सुधारः विभिन्न प्रकार के स्टॉप विकल्प उपलब्ध हैं, जो बाजार की विशेषताओं के आधार पर सबसे उपयुक्त स्टॉप मोड चुन सकते हैं।
- स्पष्ट दृश्यता: रणनीति इंटरफ़ेस में सूचक दिखाई देते हैं, जिससे व्यापारियों को बाजार की स्थिति को समझने में मदद मिलती है
- प्रतिक्रिया की लचीलापनः अनुकूलित प्रतिक्रिया समय सीमा की अनुमति देता है ताकि रणनीति अनुकूलित हो सके।
रणनीतिक जोखिम
- बाजार में उतार-चढ़ाव का खतराः बार-बार झूठे सेंध लगाने के संकेत हो सकते हैं।
- स्लाइडिंग जोखिमः कम तरलता वाले बाजारों में, स्लाइडिंग के कारण प्रवेश मूल्य में विचलन के कारण ब्रेक सिग्नल हो सकता है।
- अत्यधिक फ़िल्टरिंग का जोखिमः यदि आप मात्रा फ़िल्टरिंग को सक्षम करते हैं, तो आप कुछ प्रभावी व्यापारिक अवसरों को याद कर सकते हैं।
- पैरामीटर संवेदनशीलता: रणनीति का प्रभाव पैरामीटर सेटिंग्स के प्रति संवेदनशील है और इसके लिए सावधानीपूर्वक अनुकूलन की आवश्यकता होती है।
रणनीति अनुकूलन दिशा
- प्रवृत्ति की ताकत फ़िल्टरिंग जोड़ेंः प्रवृत्ति की ताकत के संकेतकों जैसे कि ADX को जोड़ा जा सकता है, केवल जब प्रवृत्ति मजबूत होती है तो प्रवेश करें।
- यातायात सूचकांक का अनुकूलन करेंः सादे चलती औसत के बजाय सापेक्ष यातायात या यातायात ब्रेकआउट सूचकांक का उपयोग करने पर विचार किया जा सकता है।
- समय फ़िल्टर जोड़ा गयाः ट्रेडिंग समय विंडो सेटिंग्स जोड़े गए, जो बड़े बाजार में उतार-चढ़ाव के समय से बचते हैं।
- गतिशील पैरामीटर अनुकूलनः बाजार में उतार-चढ़ाव के आधार पर चैनल चक्र और सुपरट्रेंड पैरामीटर को स्वचालित रूप से समायोजित करें।
- मशीन लर्निंग का परिचयः पैरामीटर चयन और सिग्नल फ़िल्टरिंग को अनुकूलित करने के लिए मशीन लर्निंग एल्गोरिदम का उपयोग करना।
संक्षेप
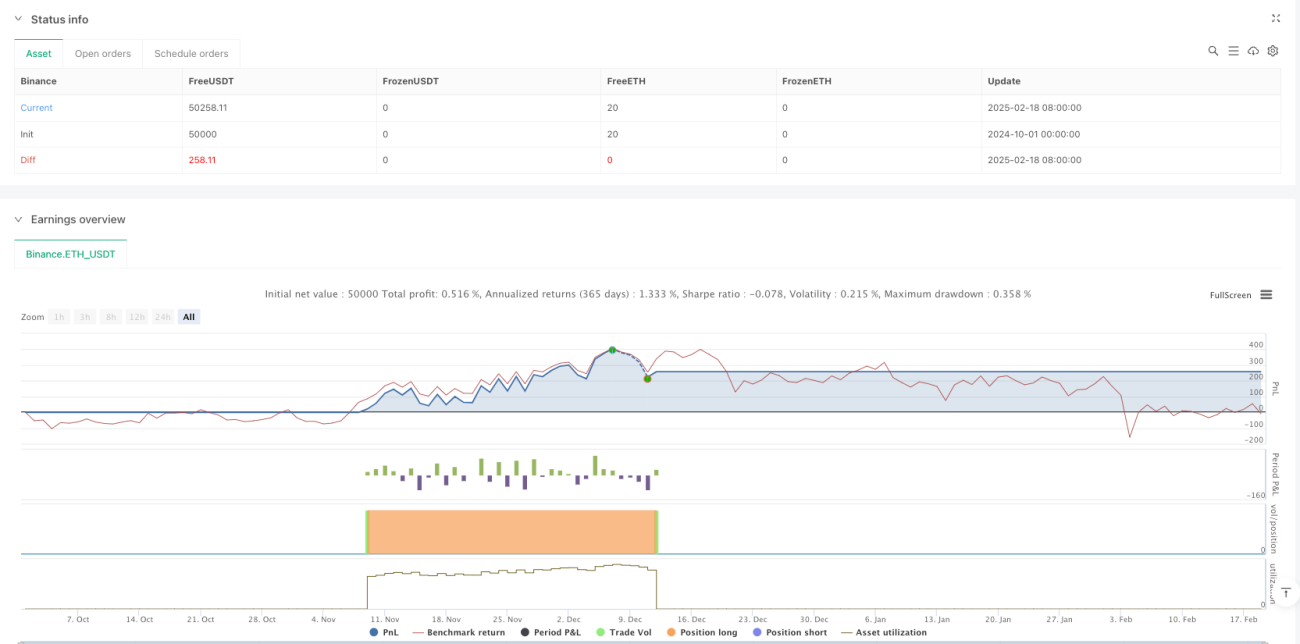
इस रणनीति का उपयोग कई तकनीकी संकेतकों के संयोजन के माध्यम से एक अपेक्षाकृत पूर्ण प्रवृत्ति ट्रैकिंग ट्रेडिंग प्रणाली का निर्माण करने के लिए किया जाता है। इस रणनीति का लाभ संकेत विश्वसनीयता, जोखिम प्रबंधन लचीलापन में है, लेकिन अभी भी व्यापारियों को विशिष्ट बाजार विशेषताओं के अनुसार पैरामीटर अनुकूलन की आवश्यकता है। निरंतर सुधार और अनुकूलन के माध्यम से, इस रणनीति को प्रवृत्ति बाजार में स्थिर व्यापार प्रभाव प्राप्त करने की उम्मीद है।
- 1