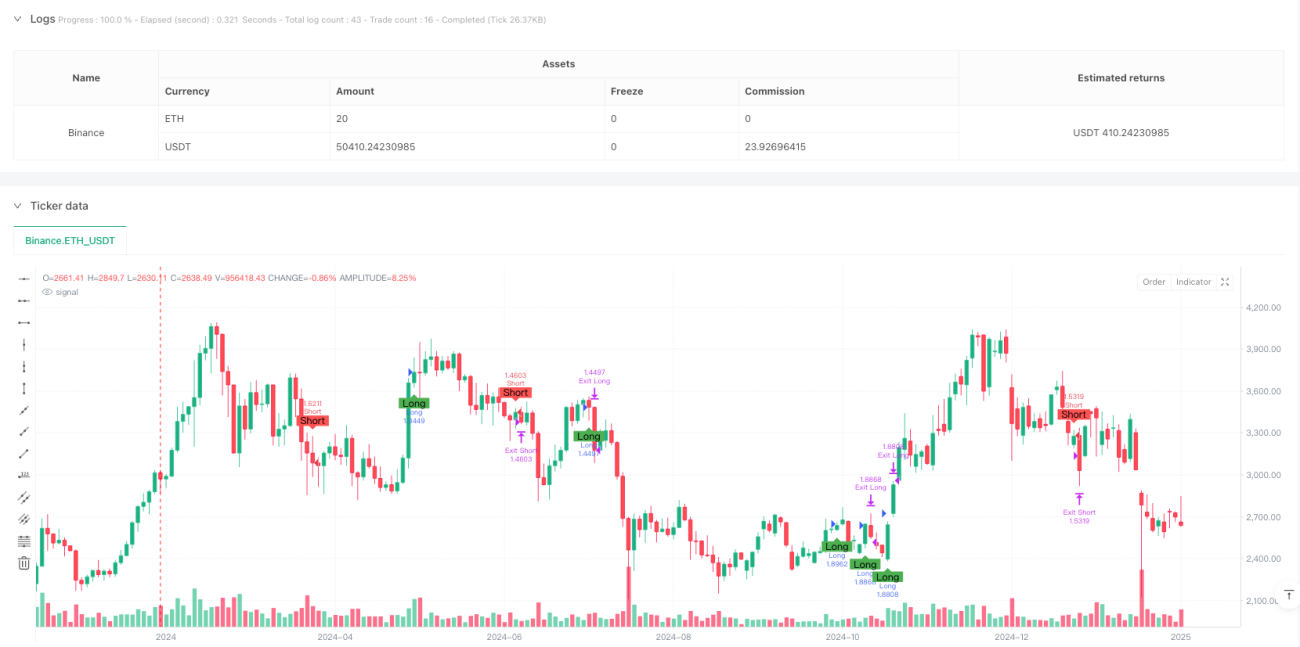
कई संकेतक बुद्धिमान प्रवृत्ति व्यापार रणनीति को पार करते हैं

अवलोकन
यह एक स्मार्ट ट्रेंड ट्रैकिंग रणनीति है जो कई तकनीकी संकेतकों के क्रॉस सिग्नल पर आधारित है। यह रणनीति तीन प्रमुख तकनीकी संकेतकों को एकीकृत करती है जैसे कि चलती औसत (ईएमए), अपेक्षाकृत मजबूत सूचक (आरएसआई) और चलती औसत प्रवृत्ति विचलन (एमएसीडी), बाजार की प्रवृत्ति को पहचानने के लिए बहुआयामी सिग्नल की पुष्टि करने के लिए, और गतिशील स्टॉप-लॉस स्टॉप के साथ जोखिम प्रबंधन के लिए। रणनीति को पूरी तरह से स्वचालित ट्रेडिंग के लिए डिज़ाइन किया गया है, विशेष रूप से दिन के कारोबार के लिए उपयुक्त है।
रणनीति सिद्धांत
इस रणनीति का मुख्य तर्क तीन स्तरों पर आधारित है:
- प्रवृत्ति की दिशा की पुष्टि करने के लिए 9 चक्रों और 21 चक्रों के सूचकांक चलती औसत (ईएमए) का उपयोग करें
- अपेक्षाकृत मजबूत संकेतकों (आरएसआई) का उपयोग करके ओवरबॉट और ओवरसोल्ड क्षेत्रों को फ़िल्टर करें और चरम बाजार स्थितियों में प्रवेश से बचें
- MACD के माध्यम से प्रवृत्ति की ताकत और दिशा की पुष्टि करें
इनपुट सिग्नल के उत्पादन के लिए निम्नलिखित शर्तों को पूरा करना आवश्यक हैः
- बहु-शर्त करेंः दीर्घकालिक ईएमए को अल्पकालिक ईएमए पर पहनें, आरएसआई 70 से कम है, और एमएसीडी लाइन सिग्नल लाइन के ऊपर है
- खाली करने की स्थितिः अल्पकालिक ईएमए के नीचे लंबे समय तक ईएमए, आरएसआई 30 से ऊपर, और एमएसीडी लाइन सिग्नल लाइन के नीचे
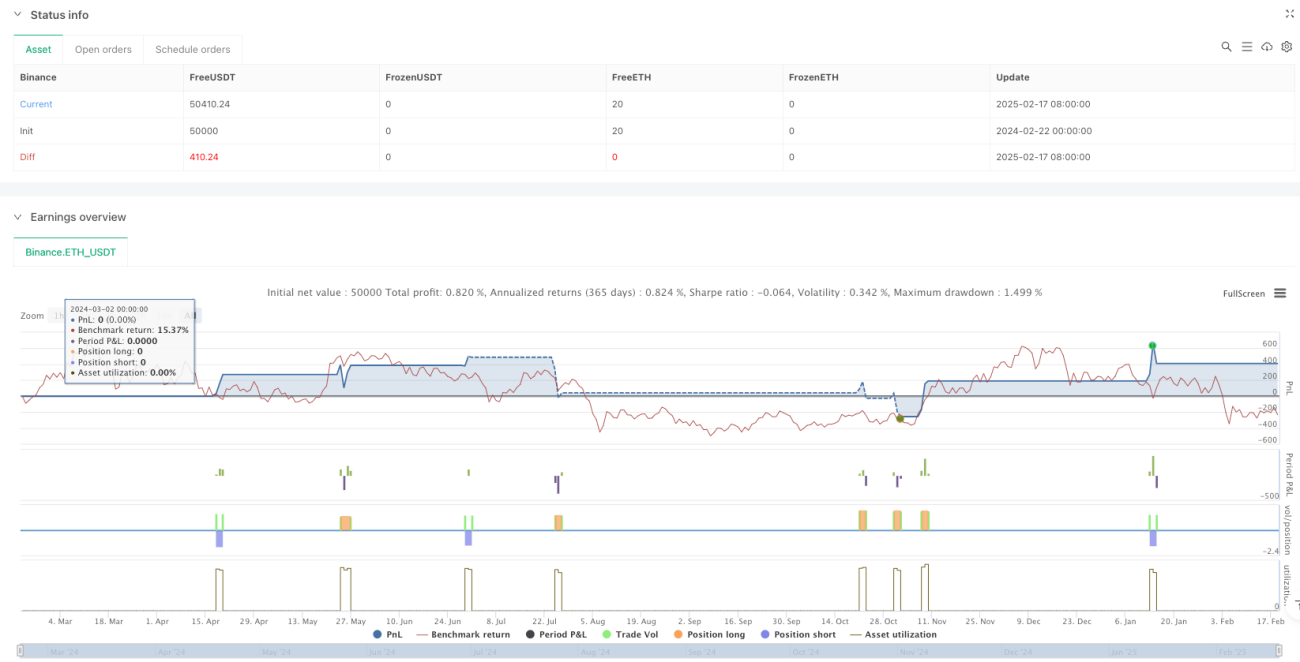
रणनीति का उपयोग पूंजी का प्रतिशत धारण करने के लिए किया जाता है, प्रत्येक लेनदेन पर 10% खाता ब्याज का उपयोग किया जाता है, और जोखिम नियंत्रण के लिए 2% स्टॉप और 1% स्टॉप-लॉस के साथ काम किया जाता है।
रणनीतिक लाभ
- कई सूचकांकों का क्रॉस-सत्यापन, झूठे संकेतों के जोखिम को काफी कम करता है
- डायनामिक स्टॉप लॉस स्टॉप सेटिंग, जो जोखिम प्रबंधन स्तर को स्वचालित रूप से प्रवेश मूल्य के अनुसार समायोजित करती है
- प्रतिशत स्थिति प्रबंधन, पूंजी उपयोग के लिए इष्टतम विन्यास
- पूरी तरह से स्वचालित निष्पादन, मानव हस्तक्षेप के बिना, कम भावनात्मक प्रभाव
- पूर्ण जोखिम प्रबंधन प्रणाली, जिसमें स्थिति नियंत्रण और रोकथाम तंत्र शामिल हैं
रणनीतिक जोखिम
- कई सूचकांकों के कारण सिग्नल में देरी हो सकती है, तेजी से चलने वाले अवसरों को याद किया जा सकता है
- निश्चित प्रतिशत स्टॉप लॉस स्टॉप को अधिक अस्थिर बाजारों में जल्दी से ट्रिगर किया जा सकता है
- तकनीकी संकेतक पर निर्भरता बाज़ार में बहुत अधिक झूठे संकेत पैदा कर सकती है
- कमीशन की लागत रणनीतिक आय पर महत्वपूर्ण प्रभाव डालती है
जोखिम नियंत्रण सुझाव:
- बाजार में उतार-चढ़ाव के आधार पर स्टॉप-स्टॉप अनुपात को गतिशील रूप से समायोजित करना
- प्रवृत्ति की ताकत फ़िल्टर को बढ़ाएं और ट्रेडों को कम करें
- रातोंरात जोखिम से बचने के लिए स्टॉक समय प्रबंधन का अनुकूलन
रणनीति अनुकूलन दिशा
- संकेतक पैरामीटर अनुकूलन
- ईएमए चक्र का अनुकूलन करें, सबसे अच्छा अल्पकालिक और दीर्घकालिक चक्र संयोजन ढूंढें
- आरएसआई के ओवरबॉट और ओवरसोल्ड थ्रेशोल्ड को अलग-अलग बाजार स्थितियों के लिए समायोजित करें
- प्रवृत्ति पहचान की सटीकता में सुधार के लिए MACD पैरामीटर का अनुकूलन करें
- जोखिम प्रबंधन अनुकूलन
- गतिशील स्टॉप लॉस स्टॉप अनुपात को लागू करना, बाजार की अस्थिरता के अनुसार स्वचालित रूप से समायोजित करना
- अधिकतम वापसी नियंत्रण में वृद्धि
- लंबे समय तक जेल में रहने से बचने के लिए समय से बाहर निकलने की व्यवस्था
- लेनदेन निष्पादन अनुकूलन
- कम तरलता वाले वातावरण में व्यापार करने से बचने के लिए वॉल्यूम फ़िल्टर बढ़ाएं
- बैचों के आधार पर गोदामों का निर्माण और गोदामों की व्यवस्था, लागत-समान मूल्य का अनुकूलन
- बाजार में अस्थिरता के संकेतकों को शामिल करना, गतिशील रूप से स्थिति अनुपात को समायोजित करना
संक्षेप
इस रणनीति के माध्यम से कई तकनीकी संकेतकों के सामंजस्यपूर्ण कार्य के माध्यम से एक अपेक्षाकृत पूर्ण प्रवृत्ति ट्रैकिंग प्रणाली का निर्माण किया गया है। इस रणनीति के फायदे संकेत की विश्वसनीयता, जोखिम प्रबंधन में सुधार, लेकिन यह भी एक निश्चित पिछड़ापन और बाजार की स्थिति पर निर्भरता है। इस रणनीति के अनुकूलन दिशा के माध्यम से अपनी अनुकूलन क्षमता और स्थिरता को और बढ़ाया जा सकता है। वास्तविक क्षेत्र के अनुप्रयोगों में, यह पर्याप्त प्रतिक्रिया और पैरामीटर अनुकूलन की सिफारिश की है, और बाजार की वास्तविक स्थिति के साथ उचित समायोजन किया गया है।
- 1