
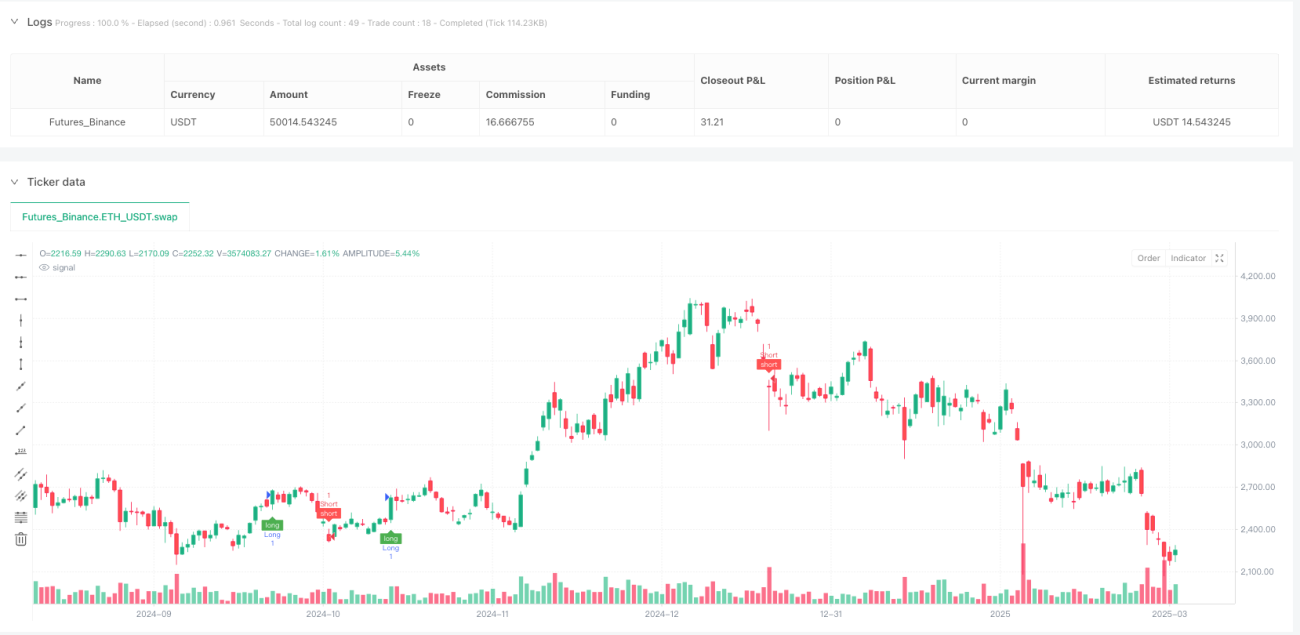
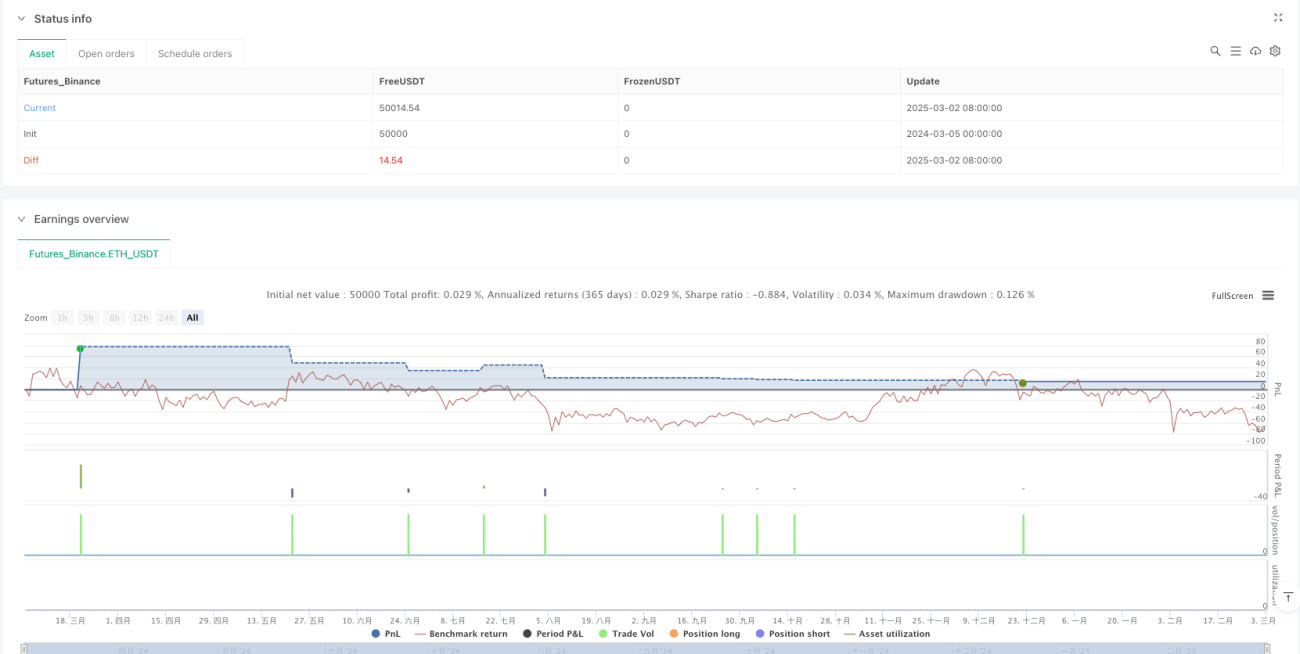
बहु-तकनीकी संकेतक सोना तत्काल परिवर्तन का पता लगाने और जोखिम प्रबंधन रणनीति एक 1-मिनट के हेइकिन आशी चार्ट पर आधारित एक सोने की ट्रेडिंग प्रणाली है, जो कई तकनीकी संकेतकों को एक ट्रेडिंग सिग्नल और पुष्टि करने के लिए उपकरण के रूप में जोड़ती है। यह रणनीति मुख्य रूप से गिरने वाले आउटपुट ((Chandelier Exit) का उपयोग करती है, और वैकल्पिक रूप से ईएमए फ़िल्टर, सुपरट्रेंड ((SuperTrend) और शेफ ट्रेंड साइकिल ((Schaff Trend Cycle) जैसे संकेतकों के साथ एक पुष्टि उपकरण के रूप में जोड़ती है। रणनीति में एक लचीला स्टॉप-स्टॉप तंत्र शामिल है, और एक दृश्य ट्रेडिंग मेटलबोर्ड प्रदान करता है, जिससे व्यापारी वास्तविक समय में व्यापार की स्थिति की निगरानी कर सकते हैं। इस बहु-आयामी तकनीकी विश्लेषण पद्धति का उद्देश्य सोने की कीमतों में अल्पकालिक उतार-चढ़ाव को तेजी से पकड़ना है, जबकि संकेतक प्रणाली द्वारा झूठे संकेतों के जोखिम को कम करना है।
यह रणनीति एक बहुस्तरीय सिग्नल पुष्टिकरण प्रणाली पर आधारित है, जिसका मुख्य तर्क इस प्रकार हैः
मुख्य संकेतक संकेत उत्पन्नरणनीति एक प्रमुख संकेतक के रूप में चैंडिलियर एक्जिट का उपयोग करती है। चैंडिलियर एक्जिट एक ट्रेंड ट्रैकिंग संकेतक है, जो स्टॉपलॉस को निर्धारित करने के लिए एटीआर (औसत वास्तविक रेंज) गुणांक का उपयोग करता है, और मल्टीहेड और खाली हेड संकेत उत्पन्न करता है।
पहचान फ़िल्टर करें: रणनीति ट्रेडरों को चुनिंदा रूप से कई पुष्टिकरण संकेतकों को सक्षम करने की अनुमति देती हैः
सिग्नल समाप्ति तंत्र: रणनीति में सिग्नल एक्सपायरी फंक्शन है, जो सिग्नल के लिए वैध टैंक की संख्या को सेट करता है, जो पुराने सिग्नल पर व्यापार को रोकता है।
लेनदेन निष्पादन तर्क: जब सभी चयनित शर्तें पूरी हो जाती हैं, तो रणनीति एक प्रवेश संकेत उत्पन्न करती है और स्वचालित रूप से एक निश्चित अंक की रोकथाम रोकथाम सेट करती है।
डाटा प्रोसेसिंग अनुकूलन: रणनीतिक उपयोग सशर्त नमूने ईएमए और एसएमए फ़ंक्शंस, और एक विशेष रेंज फ़िल्टर, तकनीकी संकेतकों की गणना की दक्षता में सुधार।
दृश्य प्रणाली: ट्रेडिंग टायरबोर्ड प्रदान करता है जो प्रत्येक सूचक की स्थिति को दर्शाता है और चार्ट पर ट्रेडिंग सिग्नल और स्टॉपलॉस की स्थिति को चिह्नित करता है।
एकाधिक सत्यापन तंत्र: एकाधिक संकेतक की पुष्टि के माध्यम से, झूठे संकेतों को काफी कम करें, ट्रेडिंग सटीकता में सुधार करें। जब कई संकेतक एक दिशा की पुष्टि करते हैं, तो ट्रेडिंग सिग्नल अधिक विश्वसनीय होते हैं।
सूचकांक का एक लचीला संयोजन: उपयोगकर्ता विभिन्न पुष्टिकरण संकेतकों को सक्षम या अक्षम करने का विकल्प चुन सकते हैं, विभिन्न बाजार स्थितियों के अनुसार रणनीति के प्रदर्शन को अनुकूलित कर सकते हैं।
सटीक जोखिम प्रबंधन: रणनीति उपयोगकर्ता को एक विशिष्ट स्टॉप-स्टॉप-लॉस पॉइंट सेट करने की अनुमति देती है, जिससे प्रत्येक ट्रेड के लिए रिस्क-रिटर्न अनुपात को ठीक से नियंत्रित किया जा सके।
सिग्नल समाप्ति नियंत्रणसिग्नल की वैधता की अवधि को सेट करके, ट्रेडिंग से बचने के लिए एक रणनीति है जो समय से पहले सिग्नल पर ट्रेड करती है, जो कि देरी के जोखिम को कम करती है।
उच्च दृश्यता वाले लेनदेन इंटरफ़ेसट्रेडिंग मेनूः ट्रेडिंग मेनू सभी सूचकांकों की स्थिति को दर्शाता है, जिससे व्यापारियों को बाजार की स्थिति का त्वरित मूल्यांकन करने में मदद मिलती है।
सोने के बाजार के लिए अनुकूलन: रणनीति सोने के बाजार की विशेषताओं के लिए पैरामीटर का अनुकूलन करती है, विशेष रूप से बिंदु मूल्य रूपांतरण ((1 बिंदु = 0.1 डॉलर) ।
उच्च आवृत्ति व्यापार अनुकूलन1 मिनट का समय चक्र रणनीति को अल्पकालिक मूल्य उतार-चढ़ाव को पकड़ने की अनुमति देता है, जो दिन के व्यापारियों के लिए उपयुक्त है।
ओवरट्रेडिंग का खतरा: 1 मिनट की अवधि में बहुत अधिक ट्रेडिंग सिग्नल उत्पन्न हो सकते हैं, जिससे ट्रेडिंग की लागत बढ़ जाती है और ओवर-ट्रेडिंग होती है। समाधान पुष्टि करने वाले संकेतकों की संख्या को समायोजित करना या सिग्नल फ़िल्टरिंग शर्तों को बढ़ाना है।
बाजार में शोर का प्रभाव: कम समय चक्र बाजार के शोर के लिए अधिक संवेदनशील है, जो झूठे संकेतों का उत्पादन करता है। उच्च अस्थिरता अवधि के दौरान सावधानी से उपयोग करने की सिफारिश की जाती है, या लंबी अवधि के साथ प्रवृत्ति की पुष्टि की जाती है।
सूचकांकों का ढेरबहु-सूचक पुष्टिकरण, जबकि झूठे संकेतों को कम करता है, सिस्टम की देरी को बढ़ाता है, जिससे कुछ लाभप्रद अवसरों को याद किया जा सकता है। प्रतिक्रिया की गति बढ़ाने के लिए पुष्टिकरण सूचक की संख्या को कम करने पर विचार किया जा सकता है।
फिक्स्ड स्टॉप लॉस की सीमाएं: फिक्स्ड पॉइंट्स के स्टॉप लॉस में बाजार की अस्थिरता को ध्यान में नहीं रखा गया है, उच्च अस्थिरता अवधि में स्टॉप लॉस बहुत करीब हो सकता है, कम अस्थिरता अवधि में स्टॉप लॉस बहुत दूर है। वर्तमान एटीआर गतिशीलता के अनुसार स्टॉप लॉस वैल्यू को समायोजित करने की सिफारिश की गई है।
सोने के बाजार में विशेष जोखिम: सोने के बाजार में कई प्रकार के मैक्रोइकॉनॉमिक कारक होते हैं, जिनमें मुद्रास्फीति के आंकड़े, केंद्रीय बैंक की नीति, भूराजनीति आदि शामिल हैं। शुद्ध तकनीकी विश्लेषण इन प्रभावों को अनदेखा कर सकता है। मौलिक विश्लेषण के साथ संयोजन में उपयोग करने की सिफारिश की जाती है।
मुख्य सूचक निर्भरता: रणनीति में एक प्रमुख सूचक के रूप में निर्यात पर बहुत अधिक निर्भरता है, जो कि बाज़ार में खराब प्रदर्शन कर सकता है। विभिन्न प्रमुख सूचकांकों का चयन करने के लिए विकल्प जोड़ने की सिफारिश की गई है।
विविधता के प्रमुख संकेतकवर्तमान में, नीति केवल प्रमुख संकेतकों के रूप में उदयशील निर्यात का समर्थन करती है। विभिन्न बाजार स्थितियों के अनुकूल विभिन्न प्रमुख संकेतकों जैसे कि ब्रिनबैंड, एमएसीडी या अनुकूलनशील चलती औसत का समर्थन करने के लिए विस्तारित किया जा सकता है।
गतिशील स्टॉप लॉसएटीआर-आधारित गतिशील स्टॉपलॉस के लिए एक निश्चित-बिंदु स्टॉपलॉस को बदलना, जो बाजार की अस्थिरता में बदलाव के लिए बेहतर रूप से अनुकूलित हो सकता है। उदाहरण के लिए,sl_value = atr(14) * 1.5निश्चित अंक के बजाय
समय फ़िल्टर एकीकरणट्रेडिंग समय फ़िल्टर को बढ़ाकर, कम तरलता के समय या महत्वपूर्ण प्रेस विज्ञप्ति के समय से बचें, जिससे स्लाइड और अप्रत्याशित मूल्य उतार-चढ़ाव के जोखिम को कम किया जा सके।
वॉल्यूम विश्लेषण जोड़ें: एक एकीकृत लेनदेन सूचक मूल्य आंदोलन की ताकत को सत्यापित करने के लिए संकेत की गुणवत्ता में सुधार कर सकता है। उदाहरण के लिए, केवल लेनदेन की मात्रा में वृद्धि होने पर ही एक ब्रेकआउट सिग्नल की पुष्टि की जाती है।
मशीन लर्निंग अनुकूलन: मशीन लर्निंग एल्गोरिदम को पेश किया गया है जो हाल के बाजार के प्रदर्शन के आधार पर सूचकांक के भार को गतिशील रूप से समायोजित करता है।
खेलों में प्रवेश: एक एकल प्रवेश और निकास बिंदु के समय जोखिम को कम करने के लिए एक विभाजन प्रविष्टि और निकास तंत्र को लागू करना, जैसे कि तीन बार गोदाम बनाना और तीन बार गोदाम बंद करना।
बहु समय चक्र की पुष्टि करें: उच्च समय चक्र की प्रवृत्ति की पुष्टि करें, केवल उच्च समय चक्र की प्रवृत्ति की दिशा में स्थितियां खोलें, प्रतिकूल व्यापार के जोखिम को कम करें।
सूचक प्रासंगिकता विश्लेषण: चयनित सूचकांकों के बीच संबंध का विश्लेषण करें, पुष्टि के रूप में अत्यधिक प्रासंगिक सूचकांकों का उपयोग करने से बचें, जो झूठी छवियों की कई पुष्टि का कारण बन सकता है।
मल्टी-टेक्निकल इंडिकेटर गोल्ड इंस्टेंट चेंज डिटेक्शन एंड रिस्क मैनेजमेंट स्ट्रैटेजी एक कॉम्प्लेक्स ट्रेडिंग सिस्टम है जो अल्पकालिक व्यापारियों के लिए है, जो कई तकनीकी संकेतकों को एकीकृत करके अधिक विश्वसनीय ट्रेडिंग सिग्नल प्रदान करता है। इस रणनीति का मुख्य लाभ इसकी लचीली संकेतक पुष्टिकरण तंत्र और एक सहज दृश्य इंटरफ़ेस है, जो व्यापारियों को बाजार की स्थिति के अनुसार रणनीति पैरामीटर को समायोजित करने की अनुमति देता है। हालांकि, उपयोगकर्ताओं को कम समय चक्र ट्रेडिंग के अंतर्निहित जोखिमों के बारे में सतर्क रहने की आवश्यकता है, जिसमें ओवर-ट्रेडिंग और बाजार शोर प्रभाव शामिल हैं।
अनुशंसित अनुकूलन उपायों को लागू करके, विशेष रूप से गतिशील स्टॉप-लॉस, बहु-समय चक्र की पुष्टि और प्रमुख संकेतकों के विविधीकरण के साथ, यह रणनीति अपनी अनुकूलन क्षमता और स्थिरता को और बढ़ा सकती है। यह रणनीति दिन के व्यापारियों और शॉर्ट-लाइन गोल्ड ट्रेडिंग के शौकीनों के लिए एक तकनीकी विश्लेषण ढांचा प्रदान करती है, लेकिन इसका उपयोग धन प्रबंधन सिद्धांतों और बाजार की बुनियादी समझ के साथ किया जाना चाहिए ताकि इष्टतम प्रभाव हो सके।
अंततः, व्यापार की सफलता न केवल रणनीति पर निर्भर करती है, बल्कि यह भी निर्भर करती है कि व्यापारी रणनीति को कैसे समझते हैं और इसे सही तरीके से निष्पादित करते हैं। निरंतर रणनीति प्रतिक्रिया, अनुकूलन और अनुकूलन दीर्घकालिक स्थिर व्यापार परिणाम प्राप्त करने की कुंजी है।
/*backtest
start: 2024-03-05 00:00:00
end: 2025-03-03 08:00:00
period: 1d
basePeriod: 1d
exchanges: [{"eid":"Futures_Binance","currency":"ETH_USDT"}]
*/
//@version=5
strategy("1 Min Gold Heikin Ashi Strategy", overlay=true, max_bars_back=500)
// Adjustable TP & SL in Pips
tp_pips = input.int(50, title="Take Profit (Pips)")
sl_pips = input.int(30, title="Stop Loss (Pips)")
// Convert pips to price value for XAUUSD (1 pip = 0.1 in Gold)
tp_value = tp_pips * 0.1
sl_value = sl_pips * 0.1
// Fixed components
justcontinue = bool(true)
ma(_source, _length, _type) =>
switch _type
"SMA" => ta.sma (_source, _length)
"EMA" => ta.ema (_source, _length)
"RMA" => ta.rma (_source, _length)
"WMA" => ta.wma (_source, _length)
"VWMA" => ta.vwma(_source, _length)
alarm(_osc, _message) =>
alert(syminfo.ticker + ' ' + _osc + ' : ' + _message + ', price (' + str.tostring(close, format.mintick) + ')')
// Conditional Sampling EMA Function
Cond_EMA(x, cond, n) =>
var val = array.new_float(0)
var ema_val = array.new_float(1)
if cond
array.push(val, x)
if array.size(val) > 1
array.remove(val, 0)
if na(array.get(ema_val, 0))
array.fill(ema_val, array.get(val, 0))
array.set(ema_val, 0, (array.get(val, 0) - array.get(ema_val, 0)) * (2 / (n + 1)) + array.get(ema_val, 0))
EMA = array.get(ema_val, 0)
EMA
// Conditional Sampling SMA Function
Cond_SMA(x, cond, n) =>
var vals = array.new_float(0)
if cond
array.push(vals, x)
if array.size(vals) > n
array.remove(vals, 0)
SMA = array.avg(vals)
SMA
// Standard Deviation Function
Stdev(x, n) =>
math.sqrt(Cond_SMA(math.pow(x, 2), 1, n) - math.pow(Cond_SMA(x, 1, n), 2))
// Range Size Function
rng_size(x, scale, qty, n) =>
ATR = Cond_EMA(ta.tr(true), 1, n)
AC = Cond_EMA(math.abs(x - x[1]), 1, n)
SD = Stdev(x, n)
rng_size = scale == 'Pips' ? qty * 0.0001 : scale == 'Points' ? qty * syminfo.pointvalue : scale == '% of Price' ? close * qty / 100 : scale == 'ATR' ? qty * ATR : scale == 'Average Change' ? qty * AC : scale == 'Standard Deviation' ? qty * SD : scale == 'Ticks' ? qty * syminfo.mintick : qty
rng_size
// Two Type Range Filter Function
rng_filt(h, l, rng_, n, type, smooth, sn, av_rf, av_n) =>
rng_smooth = Cond_EMA(rng_, 1, sn)
r = smooth ? rng_smooth : rng_
var rfilt = array.new_float(2, (h + l) / 2)
array.set(rfilt, 1, array.get(rfilt, 0))
if type == 'Type 1'
if h - r > array.get(rfilt, 1)
array.set(rfilt, 0, h - r)
if l + r < array.get(rfilt, 1)
array.set(rfilt, 0, l + r)
if type == 'Type 2'
if h >= array.get(rfilt, 1) + r
array.set(rfilt, 0, array.get(rfilt, 1) + math.floor(math.abs(h - array.get(rfilt, 1)) / r) * r)
if l <= array.get(rfilt, 1) - r
array.set(rfilt, 0, array.get(rfilt, 1) - math.floor(math.abs(l - array.get(rfilt, 1)) / r) * r)
rng_filt1 = array.get(rfilt, 0)
hi_band1 = rng_filt1 + r
lo_band1 = rng_filt1 - r
rng_filt2 = Cond_EMA(rng_filt1, rng_filt1 != rng_filt1[1], av_n)
hi_band2 = Cond_EMA(hi_band1, rng_filt1 != rng_filt1[1], av_n)
lo_band2 = Cond_EMA(lo_band1, rng_filt1 != rng_filt1[1], av_n)
rng_filt = av_rf ? rng_filt2 : rng_filt1
hi_band = av_rf ? hi_band2 : hi_band1
lo_band = av_rf ? lo_band2 : lo_band1
[hi_band, lo_band, rng_filt]
// Moving Average Function
ma_function(source, length, type) =>
if type == 'RMA'
ta.rma(source, length)
else if type == 'SMA'
ta.sma(source, length)
else if type == 'EMA'
ta.ema(source, length)
else if type == 'WMA'
ta.wma(source, length)
else if type == 'HMA'
if (length < 2)
ta.hma(source, 2)
else
ta.hma(source, length)
else
ta.vwma(source, length)
// Get Table Size
table_size(s) =>
switch s
"Auto" => size.auto
"Huge" => size.huge
"Large" => size.large
"Normal" => size.normal
"Small" => size.small
=> size.tiny
// Confirmation Setup
confirmation_counter = array.new_string(0)
confirmation_val = array.new_string(0)
confirmation_val_short = array.new_string(0)
pushConfirmation(respect, label, longCondition, shortCondition) =>
if respect
array.push(confirmation_counter, label)
array.push(confirmation_val, longCondition ? "✔️" : "❌")
array.push(confirmation_val_short, shortCondition ? "✔️" : "❌")
leadinglongcond = bool(na)
leadingshortcond = bool(na)
longCond = bool(na)
shortCond = bool(na)
longCondition = bool(na)
shortCondition = bool(na)
// Indicator Setup Inputs
setup_group = "████████ Indicator Setup ████████"
signalexpiry = input.int(defval=3, title='Signal Expiry Candle Count', group=setup_group, inline='expiry', tooltip="Number of candles to wait for all indicators to confirm a signal. Default is 3.")
alternatesignal = input.bool(true, "Alternate Signal", group=setup_group, inline='alternate')
showsignal = input.bool(true, "Show Long/Short Signal", group=setup_group, inline='showsignal', tooltip="Option to turn on/off the Long/Short signal shown on the chart.")
showdashboard = input.bool(true, "Show Dashboard", group=setup_group, inline='dashboard')
string i_tab1Ypos = input.string('bottom', 'Dashboard Position', group=setup_group, inline='dashboard2', options=['top', 'middle', 'bottom'])
string i_tab1Xpos = input.string('right', '', inline='dashboard2', group=setup_group, options=['left', 'center', 'right'])
in_dashboardtab_size = input.string(title="Dashboard Size", defval="Normal", options=["Auto", "Huge", "Large", "Normal", "Small", "Tiny"], group=setup_group, inline="dashboard3")
// Confirmation Indicator Settings
confirmation_group = "████████ Confirmation Indicators (filter) ████████"
respectce = input.bool(false, "Chandelier Exit", group=confirmation_group, inline='ce')
respectema = input.bool(false, "EMA Filter", group=confirmation_group, inline='respectema')
respectemaperiod = input.int(defval=200, minval=1, title='', group=confirmation_group, inline='respectema', tooltip="EMA filter for confirmation.")
respectst = input.bool(false, "SuperTrend", group=confirmation_group, inline='st')
respectstc = input.bool(false, "Schaff Trend Cycle (STC)", group=confirmation_group, inline='stc')
// Switchboard Indicators
switchboard_group = "████ Switch Board (Turn On/Off Overlay Indicators) ████"
switch_ema = input.bool(false, "EMA", group=switchboard_group, inline='Switch1')
switch_supertrend = input.bool(false, "Supertrend", group=switchboard_group, inline='Switch2')
switch_stc = input.bool(false, "STC", group=switchboard_group, inline='Switch3')
// ----------------------------------------
// 4. Indicator Code
// Chandelier Exit
////////////////////////////////////////////////
////// Chandelier Exit
///////////////////////////////////////////////
ChandelierE = "██████████ Chandelier Exit ██████████"
ce_length = input.int(title='ATR Period', defval=22, group=ChandelierE)
ce_mult = input.float(title='ATR Multiplier', step=0.1, defval=3.0, group=ChandelierE)
showLabels = input.bool(title='Show Buy/Sell Labels?', defval=true, group=ChandelierE)
useClose = input.bool(title='Use Close Price for Extremums?', defval=true, group=ChandelierE)
highlightState = input.bool(title='Highlight State?', defval=true, group=ChandelierE)
ce_atr = ce_mult * ta.atr(ce_length)
longStop = (useClose ? ta.highest(close, ce_length) : ta.highest(ce_length)) - ce_atr
longStopPrev = nz(longStop[1], longStop)
longStop := close[1] > longStopPrev ? math.max(longStop, longStopPrev) : longStop
shortStop = (useClose ? ta.lowest(close, ce_length) : ta.lowest(ce_length)) + ce_atr
shortStopPrev = nz(shortStop[1], shortStop)
shortStop := close[1] < shortStopPrev ? math.min(shortStop, shortStopPrev) : shortStop
var int dir = 1
dir := close > shortStopPrev ? 1 : close < longStopPrev ? -1 : dir
ce_long = dir == 1
ce_short = dir == -1
// EMA Filter
////////////////////////////////////////////////////////////////////////////
//////////// EMA Filter
////////////////////////////////////////////////////////////////////////////
respectemavalue = ta.ema(close, respectemaperiod)
isaboverespectema = close > respectemavalue
isbelowrespectema = close < respectemavalue
// SuperTrend Calculation
////////////////////////////////
///// SuperTrend
//////////////////////////////
sp_group = "██████████ SuperTrend ██████████"
Periods = input.int(title='ATR Period', defval=10, group=sp_group)
stsrc = input.source(hl2, title='Source', group=sp_group)
Multiplier = input.float(title='ATR Multiplier', step=0.1, defval=3.0, group=sp_group)
changeATR = input.bool(title='Change ATR Calculation Method?', defval=true, group=sp_group)
statr2 = ta.sma(ta.tr, Periods)
statr = changeATR ? ta.atr(Periods) : statr2
stup = stsrc - Multiplier * statr
up1 = nz(stup[1], stup)
stup := close[1] > up1 ? math.max(stup, up1) : stup
dn = stsrc + Multiplier * statr
dn1 = nz(dn[1], dn)
dn := close[1] < dn1 ? math.min(dn, dn1) : dn
sttrend = 1
sttrend := nz(sttrend[1], sttrend)
sttrend := sttrend == -1 and close > dn1 ? 1 : sttrend == 1 and close < up1 ? -1 : sttrend
stbuySignal = sttrend == 1 and sttrend[1] == -1
stsellSignal = sttrend == -1 and sttrend[1] == 1
isstup = bool(na)
isstdown = bool(na)
isstup := sttrend == 1
isstdown := sttrend != 1
// Schaff Trend Cycle (STC)
/////////////////////////
/// STC overlay signal
/////////////////////////
stc_group = "██████████ Schaff Trend Cycle (STC) ██████████"
fastLength = input.int(title='MACD Fast Length', defval=23, group=stc_group)
slowLength = input.int(title='MACD Slow Length', defval=50, group=stc_group)
cycleLength = input.int(title='Cycle Length', defval=10, group=stc_group)
d1Length = input.int(title='1st %D Length', defval=3, group=stc_group)
d2Length = input.int(title='2nd %D Length', defval=3, group=stc_group)
srcstc = input.source(title='Source', defval=close, group=stc_group)
upper = input.int(title='Upper Band', defval=75, group=stc_group)
lower = input.int(title='Lower Band', defval=25, group=stc_group)
v_show_last = input.int(2000, "Plotting Length", group=stc_group)
macd = ta.ema(srcstc, fastLength) - ta.ema(srcstc, slowLength)
k = nz(fixnan(ta.stoch(macd, macd, macd, cycleLength)))
d = ta.ema(k, d1Length)
kd = nz(fixnan(ta.stoch(d, d, d, cycleLength)))
stc = ta.ema(kd, d2Length)
stc := math.max(math.min(stc, 100), 0)
stcColor1 = stc > stc[1] ? color.green : color.red
stcColor2 = stc > upper ? color.green : stc <= lower ? color.red : color.orange
upperCrossover = ta.crossover(stc, upper)
upperCrossunder = ta.crossunder(stc, upper)
lowerCrossover = ta.crossover(stc, lower)
lowerCrossunder = ta.crossunder(stc, lower)
stcup = stc >= upper
stcdown = stc <= lower
// ----------------------------------------
// 5. Switchboard Code
// Additional code for EMA from Switchboard
/////////////////////////////////////////////////////////////////////////
// EMA Selection
/////////////////////////////////////////////////////////////////////////
ma_group= "██████████ MAs Line ██████████"
len1bool = input.bool(true, '', group=ma_group, inline='len1')
len1 = input.int(5, title='MA 1', group=ma_group, inline='len1')
string ma_1_type = input.string(defval='EMA', title='Type', options=['RMA', 'SMA', 'EMA', 'WMA', 'HMA', 'VWMA'], inline='len1', group=ma_group)
color ma_1_colour = input.color(color.rgb(254, 234, 74, 0), '', inline='len1', group=ma_group)
len2bool = input.bool(true, '', group=ma_group, inline='len2')
len2 = input.int(13, minval=1, title='MA 2', group=ma_group, inline='len2')
string ma_2_type = input.string(defval='EMA', title='Type', options=['RMA', 'SMA', 'EMA', 'WMA', 'HMA', 'VWMA'], inline='len2', group=ma_group)
color ma_2_colour = input.color(color.rgb(253, 84, 87, 0), '', inline='len2', group=ma_group)
len3bool = input.bool(false, '', group=ma_group, inline='len3')
len3 = input.int(20, minval=1, title='MA 3', group=ma_group, inline='len3')
string ma_3_type = input.string(defval='EMA', title='Type', options=['RMA', 'SMA', 'EMA', 'WMA', 'HMA', 'VWMA'], inline='len3', group=ma_group)
color ma_3_colour = input.color(color.new(color.aqua, 0), '', inline='len3', group=ma_group)
len4bool = input.bool(true, '', group=ma_group, inline='len4')
len4 = input.int(50, minval=1, title='MA 4', group=ma_group, inline='len4')
string ma_4_type = input.string(defval='EMA', title='Type', options=['RMA', 'SMA', 'EMA', 'WMA', 'HMA', 'VWMA'], inline='len4', group=ma_group)
color ma_4_colour = input.color(color.new(color.blue, 0), '', inline='len4', group=ma_group)
len5bool = input.bool(true, '', group=ma_group, inline='len5')
len5 = input.int(200, minval=1, title='MA 5', group=ma_group, inline='len5')
string ma_5_type = input.string(defval='EMA', title='Type', options=['RMA', 'SMA', 'EMA', 'WMA', 'HMA', 'VWMA'], inline='len5', group=ma_group)
color ma_5_colour = input.color(color.new(color.white, 0), '', inline='len5', group=ma_group)
// Request Security for MA calculations
ema1 = request.security(syminfo.tickerid, timeframe.period, ma_function(close, len1, ma_1_type))
ema2 = request.security(syminfo.tickerid, timeframe.period, ma_function(close, len2, ma_2_type))
ema3 = request.security(syminfo.tickerid, timeframe.period, ma_function(close, len3, ma_3_type))
ema4 = request.security(syminfo.tickerid, timeframe.period, ma_function(close, len4, ma_4_type))
ema5 = request.security(syminfo.tickerid, timeframe.period, ma_function(close, len5, ma_5_type))
// Plot the Moving Averages
plot(len1bool and switch_ema ? ema1 : na, color=ma_1_colour, linewidth=2, title='MA 1')
plot(len2bool and switch_ema ? ema2 : na, color=ma_2_colour, linewidth=2, title='MA 2')
plot(len3bool and switch_ema ? ema3 : na, color=ma_3_colour, linewidth=2, title='MA 3')
plot(len4bool and switch_ema ? ema4 : na, color=ma_4_colour, linewidth=2, title='MA 4')
plot(len5bool and switch_ema ? ema5 : na, color=ma_5_colour, linewidth=2, title='MA 5')
// Additional code for SuperTrend from switchboard
///////////////////////////////////////////////////
// SuperTrend - Switchboard
///////////////////////////////////////////////////
upPlot = plot(sttrend == 1 and switch_supertrend ? stup : na, title='Up Trend', style=plot.style_linebr, linewidth=2, color=color.new(color.green, 0))
plotshape(stbuySignal and switch_supertrend ? stup : na, title='UpTrend Begins', location=location.absolute, style=shape.circle, size=size.tiny, color=color.new(color.green, 0))
dnPlot = plot(sttrend != 1 and switch_supertrend ? dn : na, title='Down Trend', style=plot.style_linebr, linewidth=2, color=color.new(color.red, 0))
plotshape(stsellSignal and switch_supertrend ? dn : na, title='DownTrend Begins', location=location.absolute, style=shape.circle, size=size.tiny, color=color.new(color.red, 0))
// Additional code for Schaff Trend Cycle (STC) from switchboard
/////////////////////////////////////////////
// Schaff Trend Cycle (STC) - Switchboard
/////////////////////////////////////////////
plotshape(stcdown and switch_stc ? true : na, style=shape.circle, location=location.top, show_last=v_show_last, color=color.new(color.red, 0), title='STC Sell')
plotshape(stcup and switch_stc ? true : na, style=shape.circle, location=location.top, show_last=v_show_last, color=color.new(color.green, 0), title='STC Buy')
// ----------------------------------------
// 6. Declare and Initialize 'leadingindicator'
leadingindicator = input.string(title="Leading Indicator", defval="Chandelier Exit",
options=["Chandelier Exit"], group="████████ Main Indicator (signal) ████████")
// 6. Leading Indicator Logic
if leadingindicator == 'Chandelier Exit'
leadinglongcond := ce_long
leadingshortcond := ce_short
// ----------------------------------------
// 7. Confirmation Indicator Logic
longCond := leadinglongcond
shortCond := leadingshortcond
longCond := longCond and (respectce ? ce_long : justcontinue)
shortCond := shortCond and (respectce ? ce_short : justcontinue)
longCond := longCond and (respectema ? isaboverespectema : justcontinue)
shortCond := shortCond and (respectema ? isbelowrespectema : justcontinue)
longCond := longCond and (respectst ? isstup : justcontinue)
shortCond := shortCond and (respectst ? isstdown : justcontinue)
longCond := longCond and (respectstc ? stcup : justcontinue)
shortCond := shortCond and (respectstc ? stcdown : justcontinue)
// ----------------------------------------
// 8. Function to Update Dashboard Label
pushConfirmation(respectce, "Chandelier Exit", ce_long, ce_short)
pushConfirmation(respectema, "EMA", isaboverespectema, isbelowrespectema)
pushConfirmation(respectst, "SuperTrend", isstup, isstdown)
pushConfirmation(respectstc, "Schaff Trend Cycle", stcup, stcdown)
// ----------------------------------------
// 9. Final Part (Dashboard Table and Signal Plotting)
leadingstatus = leadinglongcond ? "✔️" : "❌"
leadingstatus_short = leadingshortcond ? "✔️" : "❌"
rowcount = int(na)
if array.size(confirmation_counter) == 0
rowcount := 5
else
rowcount := array.size(confirmation_counter) + 4
// Signal Expiry Logic
var int leadinglong_count = 0
var int leadinglong_count2 = 0
var int leadingshort_count = 0
var int leadingshort_count2 = 0
if leadinglongcond
leadinglong_count := leadinglong_count + 1
leadinglong_count2 := leadinglong_count
for i = 1 to 100
if leadinglongcond[i]
leadinglong_count := leadinglong_count + 1
leadinglong_count2 := leadinglong_count
else
leadinglong_count := 0
break
if leadingshortcond
leadingshort_count := leadingshort_count + 1
leadingshort_count2 := leadingshort_count
for i = 1 to 100
if leadingshortcond[i]
leadingshort_count := leadingshort_count + 1
leadingshort_count2 := leadingshort_count
else
leadingshort_count := 0
break
// Expiry Condition
CondIni = 0
// If expiry option is used
longcond_withexpiry = longCond and leadinglong_count2 <= signalexpiry
shortcond_withexpiry = shortCond and leadingshort_count2 <= signalexpiry
// Without expiry
longCondition := longcond_withexpiry and CondIni[1] == -1
shortCondition := shortcond_withexpiry and CondIni[1] == 1
if alternatesignal
longCondition := longcond_withexpiry and CondIni[1] == -1
shortCondition := shortcond_withexpiry and CondIni[1] == 1
else
longCondition := longcond_withexpiry
shortCondition := shortcond_withexpiry
CondIni := longcond_withexpiry ? 1 : shortcond_withexpiry ? -1 : CondIni[1]
// Check if expiry count is crossed
is_expiry_count_crossed_long = leadinglong_count2 >= signalexpiry
is_expiry_count_crossed_short = leadingshort_count2 >= signalexpiry
// Plot signals on chart
plotshape(showsignal ? (longCondition[1] ? false : longCondition) : na, title='Buy Signal', text='long', textcolor=color.new(color.white, 0), style=shape.labelup, size=size.tiny, location=location.belowbar, color=color.new(color.green, 0))
plotshape(showsignal ? (shortCondition[1] ? false : shortCondition) : na, title='Sell Signal', text='short', textcolor=color.new(color.white, 0), style=shape.labeldown, size=size.tiny, location=location.abovebar, color=color.new(color.red, 0))
// Alerts
alertcondition(longCondition, title='Buy Alert', message='BUY')
alertcondition(shortCondition, title='Sell Alert', message='SELL')
alertcondition(longCondition or shortCondition, title='Buy or Sell Alert', message="Buy or Sell Alert")
/// ----------------------------------------
// 10. Strategy Execution - Entries & Exits
// Use already declared TP & SL values (from the start of the script)
// Long Entry Conditions
if longCondition
strategy.entry("Long", strategy.long)
strategy.exit("TakeProfit_Long", from_entry="Long", limit=close + tp_value, stop=close - sl_value)
// Short Entry Conditions
if shortCondition
strategy.entry("Short", strategy.short)
strategy.exit("TakeProfit_Short", from_entry="Short", limit=close - tp_value, stop=close + sl_value)