
सारांश
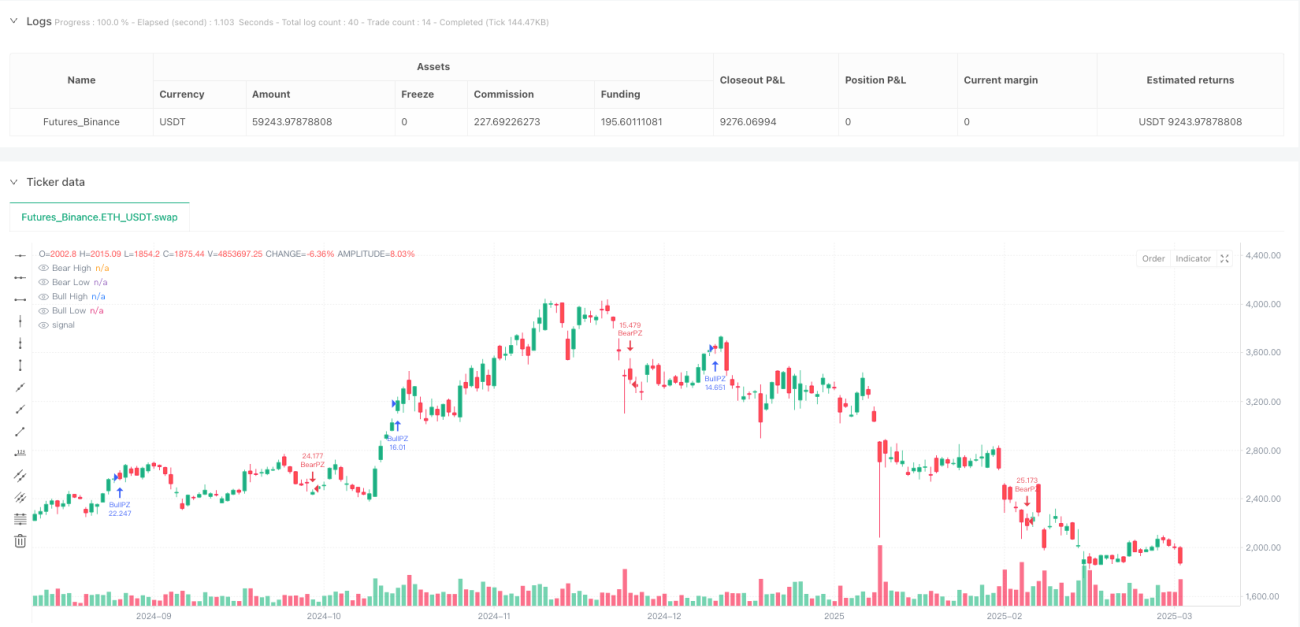
PowerZone ट्रेडिंग रणनीति एक अभिनव स्वचालित ट्रेडिंग दृष्टिकोण है जो बाजार में मजबूत मूल्य आंदोलनों को पकड़ने पर केंद्रित है। यह रणनीति विशिष्ट मूल्य क्षेत्रों (जिन्हें "PowerZones" कहा जाता है) की पहचान करके व्यापारियों को स्पष्ट प्रवेश और निकास संकेत प्रदान करती है, साथ ही इसमें अंतर्निहित जोखिम प्रबंधन तंत्र शामिल है।
रणनीति सिद्धांत
रणनीति का मूल दो प्रमुख PowerZone प्रकारों की पहचान पर आधारित है:
-
बुलिश PowerZone (Bullish PowerZone):
- प्रारंभ में एक बेयरिश कैंडल (समापन मूल्य खुलने वाले मूल्य से कम)
- इसके बाद लगातार कई कैंडल (डिफ़ॉल्ट 5) बढ़ती प्रवृत्ति दिखाते हैं
- कुल मूल्य परिवर्तन पूर्व निर्धारित सीमा (डिफ़ॉल्ट 2%) से अधिक
-
बेयरिश PowerZone (Bearish PowerZone):
- प्रारंभ में एक बुलिश कैंडल (समापन मूल्य खुलने वाले मूल्य से अधिक)
- इसके बाद लगातार कई कैंडल घटती प्रवृत्ति दिखाते हैं
- कुल मूल्य परिवर्तन पूर्व निर्धारित सीमा से अधिक
रणनीति के लाभ
- प्रवृत्ति परिवर्तन बिंदुओं की स्वचालित पहचान
- अंतर्निहित लचीली पैरामीटर अनुकूलन क्षमता
- स्पष्ट दृश्य प्रदर्शन
- स्वचालित जोखिम प्रबंधन (लाभ-हानि सीमा)
- विभिन्न बाजार स्थितियों में उपयुक्त
- कोड सरल, समझने और संशोधित करने में आसान
रणनीति के जोखिम
- अनुचित पैरामीटर सेटिंग अत्यधिक ट्रेडिंग का कारण बन सकती है
- साइडवे बाजार में गलत संकेत उत्पन्न हो सकते हैं
- निश्चित पोजीशन साइज एकल ट्रेड में हानि के जोखिम को बढ़ा सकता है
- जटिल फ़िल्टर तंत्र की कमी
- व्यापक बाजार प्रवृत्तियों और चक्रों पर विचार नहीं किया गया
रणनीति अनुकूलन दिशाएँ
-
अतिरिक्त फ़िल्टर शर्तें शामिल करें
- प्रवृत्ति संकेतक (जैसे EMA) के साथ संयोजन
- मोमेंटम संकेतक (जैसे RSI) का एकीकरण
- वॉल्यूम पुष्टि तंत्र जोड़ें
-
गतिशील पोजीशन प्रबंधन
- बाजार की अस्थिरता के अनुसार पोजीशन साइज समायोजित करें
- जोखिम प्रतिशत के आधार पर पोजीशन नियंत्रण लागू करें
-
मल्टी-टाइमफ्रेम सत्यापन
- विभिन्न समय अवधियों में संकेतों का क्रॉस-वेरिफिकेशन
- संकेतों की विश्वसनीयता बढ़ाएँ
निष्कर्ष
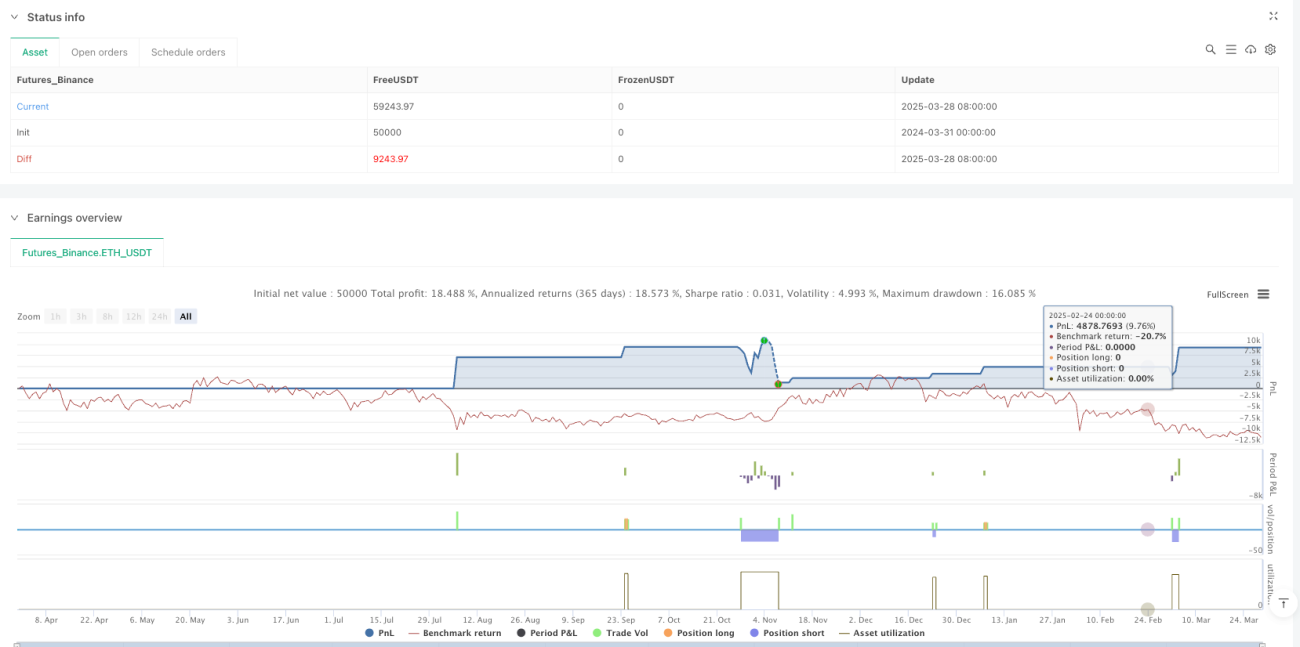
PowerZone ट्रेडिंग रणनीति मूल्य के मजबूत क्षेत्रों की व्यवस्थित पहचान करके व्यापारियों को एक संरचित ट्रेडिंग दृष्टिकोण प्रदान करती है। इसका मुख्य लाभ स्वचालन, विज़ुअलाइज़ेशन और लचीलापन है, लेकिन साथ ही पैरामीटर को सावधानीपूर्वक समायोजित करने और जोखिम प्रबंधन तंत्र को निरंतर अनुकूलित करने की आवश्यकता है।
/*backtest
start: 2024-03-31 00:00:00
end: 2025-03-29 08:00:00
period: 1d
basePeriod: 1d
exchanges: [{"eid":"Futures_Binance","currency":"ETH_USDT"}]
*/

// This Pine Script® code is subject to the terms of the Mozilla Public License 2.0 at https://mozilla.org/MPL/2.0/
// © tradingbauhaus

//@version=6- 1