एकाधिक गति संकेतक प्रवृत्ति अनुसरण मात्रात्मक ट्रेडिंग रणनीति

अवलोकन
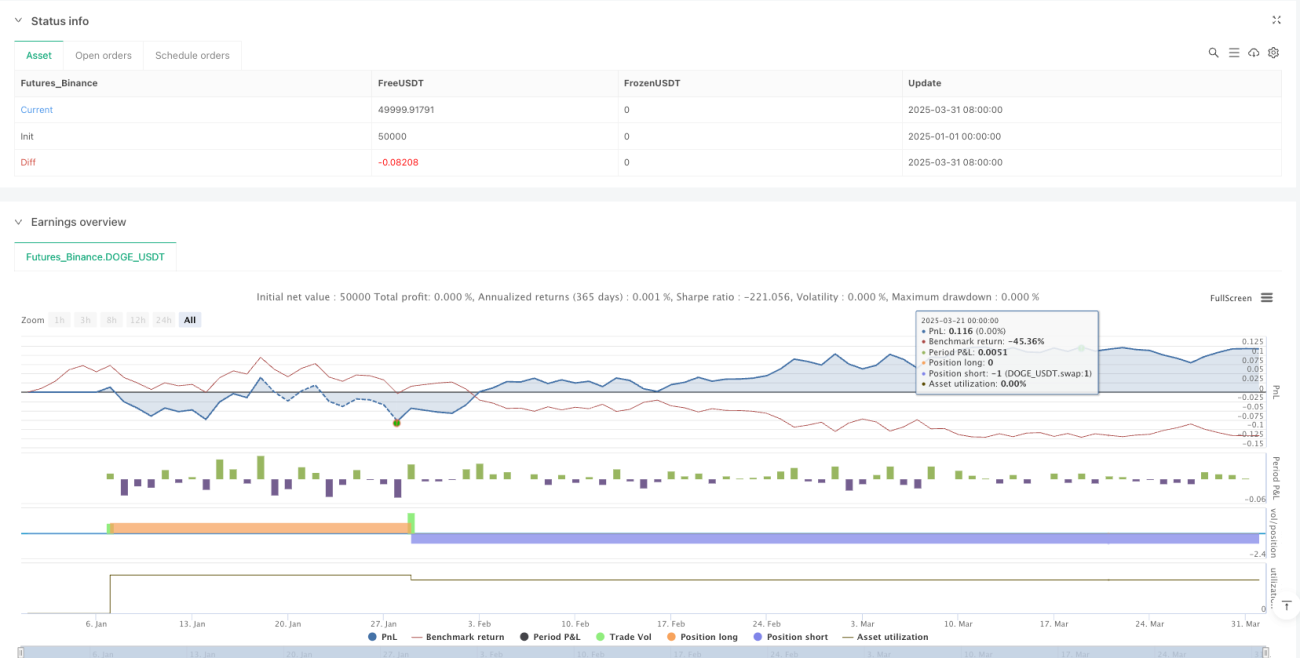
मल्टीपल मोमेंटम इंडेक्स ट्रेंड ट्रैकिंग क्वांटिटेटिव ट्रेडिंग रणनीति एक संयुक्त क्वांटिटेटिव ट्रेडिंग विधि है जो एक्सपोनेंशियल मूविंग एवरेज (EMA), रिलेटिव स्ट्रेंथ इंडेक्स (RSI) और मूविंग एवरेज कन्वर्जेंस डाइवर्जेंस (MACD) को जोड़ती है। यह रणनीति कई तकनीकी संकेतकों को एकीकृत करके ट्रेडिंग सिग्नल की सटीकता और विश्वसनीयता बढ़ाने का प्रयास करती है, विशेष रूप से उच्च अस्थिरता वाले बाजारों में अल्पकालिक और मध्यम अवधि के ट्रेडिंग के लिए उपयुक्त है।
रणनीति सिद्धांत
इस रणनीति का मुख्य सिद्धांत बहु-संकेतक संयुक्त सत्यापन है:
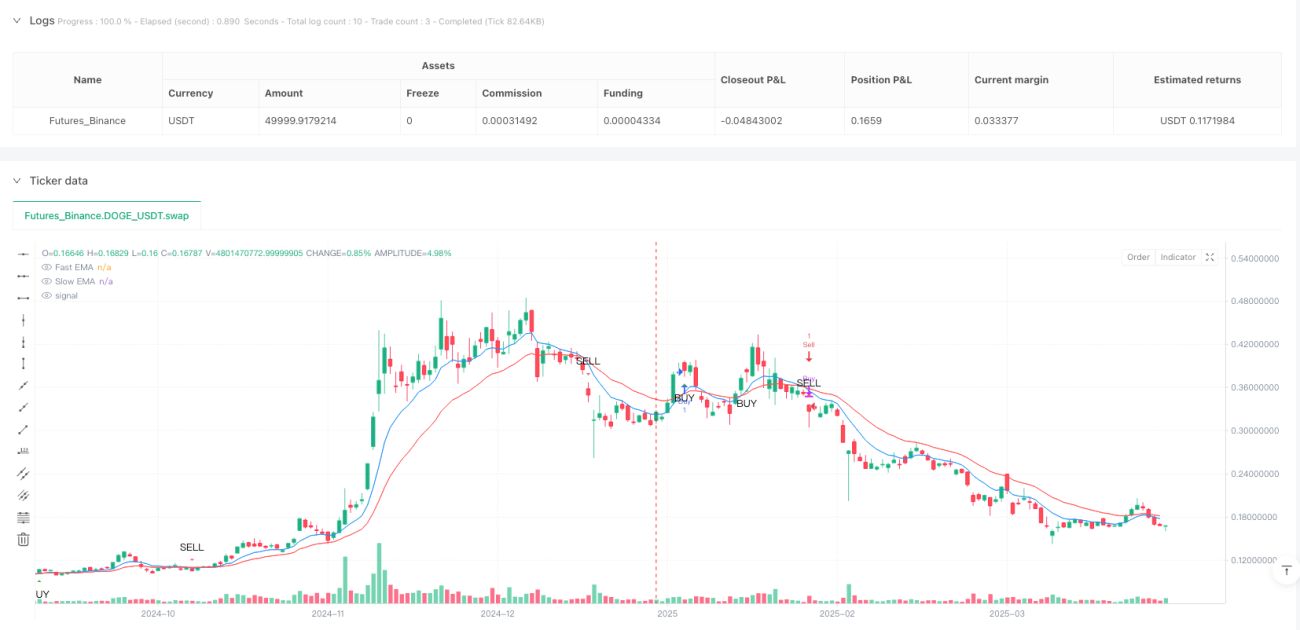
- तेज़ EMA (9 अवधि) और धीमी EMA (21 अवधि) का उपयोग करके प्रवृत्ति दिशा और गति परिवर्तन का निर्धारण करना।
- RSI (14 अवधि) के माध्यम से बाजार की गति और ओवरबॉट/ओवरसोल्ड स्थिति की पुष्टि करना।
- MACD संकेतक का उपयोग करके प्रवृत्ति की गति और दिशा की पुष्टि करना।
विशिष्ट ट्रेडिंग सिग्नल उत्पन्न करने के नियम:
- जब तेज़ EMA धीमी EMA को ऊपर से पार करती है, और RSI > 50, MACD रेखा सिग्नल रेखा से ऊपर होती है, तो खरीदारी का संकेत उत्पन्न होता है।
- जब तेज़ EMA धीमी EMA को नीचे से पार करती है, और RSI < 50, MACD रेखा सिग्नल रेखा से नीचे होती है, तो बिक्री का संकेत उत्पन्न होता है।
रणनीति के लाभ
- बहु-संकेतक संयुक्त सत्यापन से झूठे संकेतों का जोखिम काफी कम हो जाता है।
- बाजार की प्रवृत्ति में बदलाव को गतिशील रूप से पकड़ता है, अनुकूलन क्षमता मजबूत होती है।
- पैरामीटर समायोज्य हैं, विभिन्न बाजार स्थितियों के अनुसार लचीला प्रतिक्रिया।
- सिग्नल उत्पन्न करने का तर्क स्पष्ट है, समझने और लागू करने में आसान।
- उच्च अस्थिरता वाले बाजारों में अल्पकालिक और मध्यम अवधि के ट्रेडिंग के लिए उपयुक्त।
रणनीति जोखिम
- साइडवेज़ बाजार में बार-बार अप्रभावी ट्रेड उत्पन्न हो सकते हैं।
- संकेतक पैरामीटर का अनुचित चयन ट्रेडिंग दक्षता को कम कर सकता है।
- ट्रेडिंग लागत और स्लिपेज के प्रभाव पर विचार नहीं किया गया है।
- एकल बाजार वातावरण में रणनीति की स्थिरता सीमित है।
रणनीति अनुकूलन दिशाएँ
- अतिरिक्त फ़िल्टरिंग शर्तें जोड़ना, जैसे कि वॉल्यूम पुष्टि।
- स्टॉप-लॉस और टेक-प्रॉफिट तंत्र शामिल करना।
- EMA, RSI और MACD पैरामीटर को गतिशील रूप से समायोजित करना।
- मशीन लर्निंग-आधारित पैरामीटर स्व-अनुकूलन एल्गोरिदम विकसित करना।
- अधिक बाजार वातावरण के निर्णय संकेतक शामिल करना।
निष्कर्ष
मल्टीपल मोमेंटम इंडेक्स ट्रेंड ट्रैकिंग क्वांटिटेटिव ट्रेडिंग रणनीति EMA, RSI और MACD तीन प्रमुख तकनीकी संकेतकों को एकीकृत करके एक अपेक्षाकृत मजबूत ट्रेडिंग सिग्नल उत्पादन प्रणाली बनाती है। यह रणनीति पर्याप्त लचीलापन बनाए रखती है और इसमें मजबूत जोखिम नियंत्रण क्षमता भी होती है, जो क्वांटिटेटिव ट्रेडर्स के लिए एक गहन शोध योग्य ट्रेडिंग समाधान प्रदान करती है।
- 1