मात्रात्मक लंबी और छोटी प्रवृत्ति ट्रैकिंग गतिशील स्टॉप लॉस रणनीति

अवलोकन
यह एक बहुआयामी प्रवृत्ति ट्रैकिंग रणनीति है जो औसत वास्तविक अस्थिरता रेंज (एटीआर) और सूचकांक चलती औसत (ईएमए) पर आधारित है। यह रणनीति गतिशील स्टॉप लॉस और प्रवृत्ति निर्णय के माध्यम से बाजार की प्रवृत्तियों को सटीक रूप से पकड़ने और जोखिम प्रबंधन के लिए अनुमति देती है।
रणनीति सिद्धांत
इस रणनीति के मूल सिद्धांतों में निम्नलिखित प्रमुख कदम शामिल हैंः
- एटीआर सूचक का उपयोग करके गतिशील स्टॉपलॉस की गणना करें
- ईएमए के साथ मूल्य प्रवृत्ति की दिशा
- मूल्य और स्टॉपलॉस के सापेक्ष स्थान द्वारा ट्रेडिंग सिग्नल का निर्धारण
- Heikin Ashi फ़िल्टरिंग का उपयोग करके सिग्नल पहचान का चयनात्मक अनुकूलन
मुख्य कंप्यूटिंग तर्क:
- गतिशील स्टॉपलॉस = वर्तमान मूल्य ± (एटीआर * संवेदनशील गुणांक)
- ईएमए और स्टॉपलॉस के क्रॉसिंग के आधार पर ट्रेंड जजमेंट
- जब कीमत स्टॉपलॉस को पार करती है और ईएमए को पार करती है तो एक ट्रेडिंग सिग्नल उत्पन्न होता है
रणनीतिक लाभ
- गतिशील जोखिम प्रबंधनः एटीआर स्टॉपलॉस की गणना करने के लिए अनुकूलित है, जो बाजार में उतार-चढ़ाव के आधार पर वास्तविक समय में समायोजित होता है
- ट्रेंड ट्रैकिंग सटीकताः ईएमए तेजी से मूल्य परिवर्तनों के लिए प्रतिक्रिया करता है, ट्रेंड टर्नओवर को पकड़ता है
- लचीलापनः अनुकूलित एटीआर चक्र और संवेदनशीलता गुणांक
- वैकल्पिक हेकेन एचिप मानचित्र, सिग्नल पहचान को और अनुकूलित करने के लिए
- कम आवृत्ति वाले लेनदेन, कम लेनदेन लागत
- कई बाजारों और कई किस्मों के लिए अनुकूल
रणनीतिक जोखिम
- बाजार में उतार-चढ़ाव से गलत संकेत मिल सकते हैं
- अनुचित पैरामीटर सेट करने से अत्यधिक व्यापार हो सकता है
- मौलिक कारकों और आकस्मिक घटनाओं के प्रभाव को ध्यान में नहीं रखा गया
- फीडबैक और फिक्स्ड डिस्क के बीच कुछ अंतर
जोखिम नियंत्रण सुझाव:
- अनुकूलन पैरामीटर, संवेदनशीलता घटाने
- अन्य संकेतक के साथ
- स्टॉप लॉस और पोजीशन मैनेजमेंट सेट करें
- निरंतर निगरानी और गतिशील समायोजन
रणनीति अनुकूलन दिशा
- मशीन सीखने एल्गोरिदम के लिए गतिशील अनुकूलन मापदंडों का परिचय
- बहु-समय चक्र सत्यापन जोड़ें
- अन्य तकनीकी संकेतकों के साथ संयोजन
- अनुकूलित पैरामीटर चयन तंत्र विकसित करना
- जोड़ा गया जोखिम समायोजन मॉड्यूल
अनुकूलन लक्ष्यः रणनीतिक स्थिरता में वृद्धि, पीछे हटने को कम करना और लाभप्रदता में वृद्धि करना
संक्षेप
यह एटीआर और ईएमए पर आधारित एक गतिशील प्रवृत्ति ट्रैकिंग रणनीति है, जो लचीली रोकथाम तंत्र और प्रवृत्ति के निर्णय के माध्यम से अपेक्षाकृत स्थिर बाजार भागीदारी को प्राप्त करती है। रणनीति में अच्छी अनुकूलनशीलता और जोखिम प्रबंधन विशेषताएं हैं, लेकिन अभी भी निरंतर अनुकूलन और सत्यापन की आवश्यकता है।
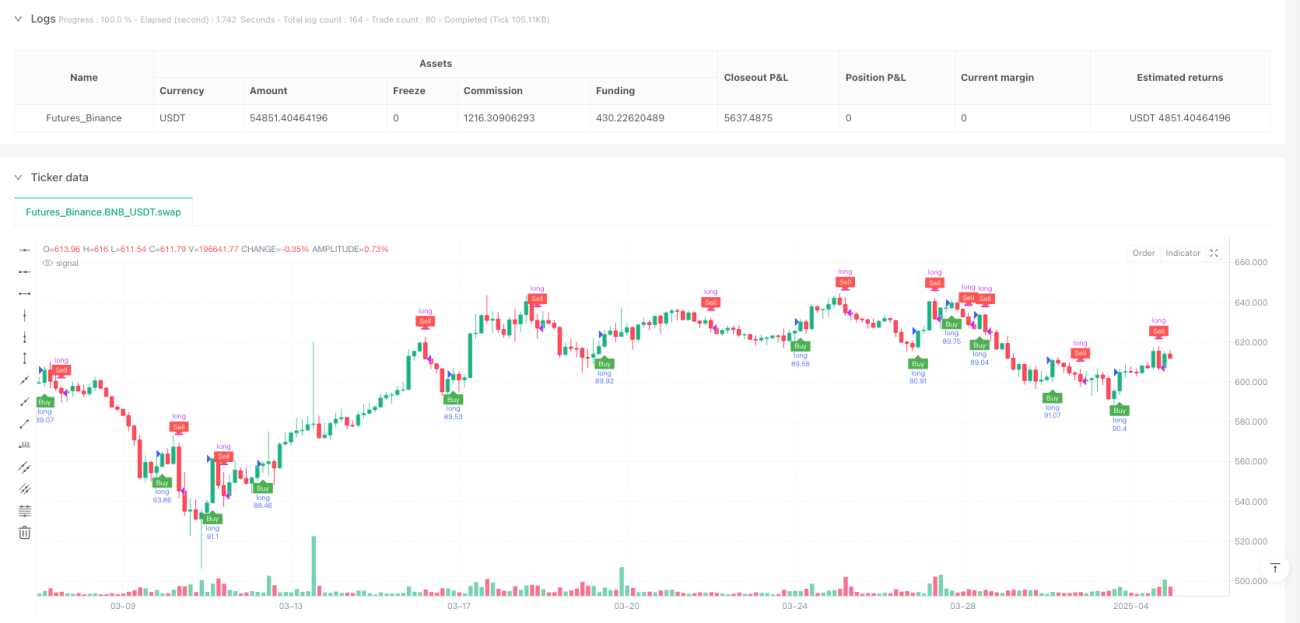
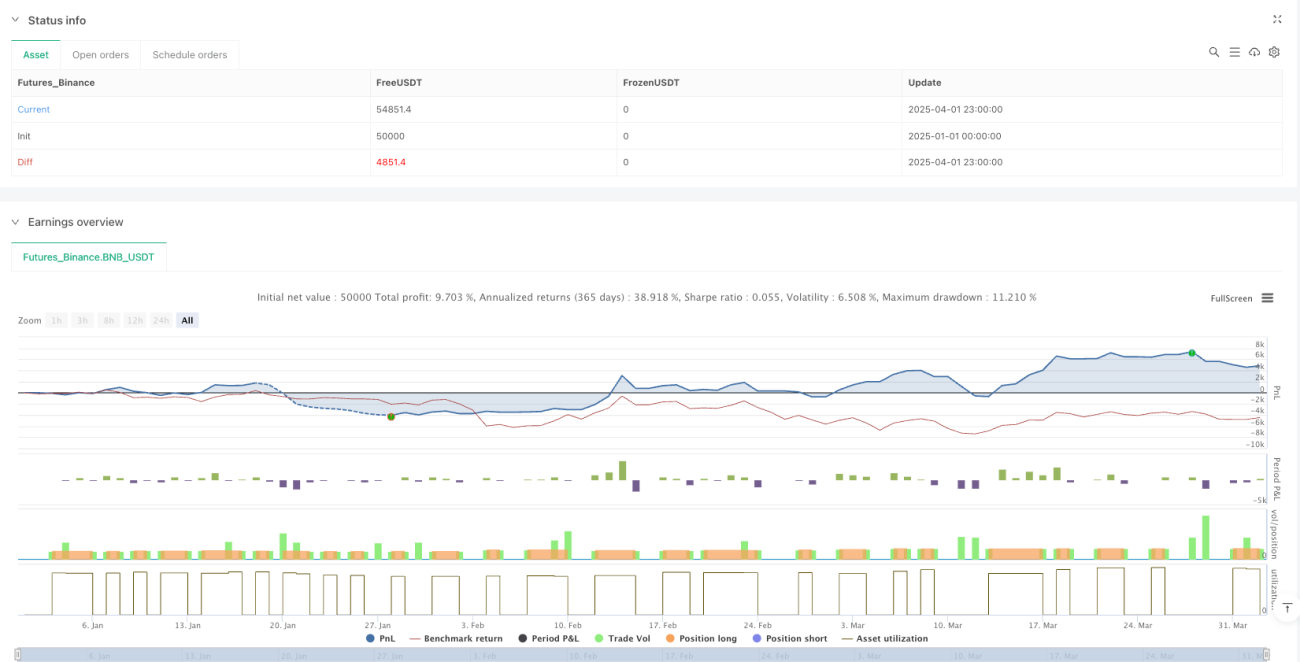
/*backtest
start: 2025-01-01 00:00:00
end: 2025-04-02 00:00:00
period: 3h
basePeriod: 3h
exchanges: [{"eid":"Futures_Binance","currency":"BNB_USDT"}]
*/

//@version=6
strategy("ducanhmaster v1", overlay=true, commission_type=strategy.commission.percent, commission_value=0.1, slippage=3, default_qty_type=strategy.percent_of_equity, default_qty_value=100)

// Inputs- 1