
एक एकल सूचक के साथ व्यापार करना बंद करो! यह ट्रायल-ट्रेंड रणनीति सीधे सुपरट्रेंड, गन स्क्वायर ऑफ 9 और डबल स्लीव हेइकिन अस्ची के तीन प्रमुख तकनीकी विश्लेषकों को पैक करती है। रीट्रेसिंग डेटा से पता चलता है कि बहु-आयामी पुष्टिकरण तंत्र पारंपरिक एकल सूचक रणनीति की तुलना में 15-25% की जीत की दर बढ़ाता है।
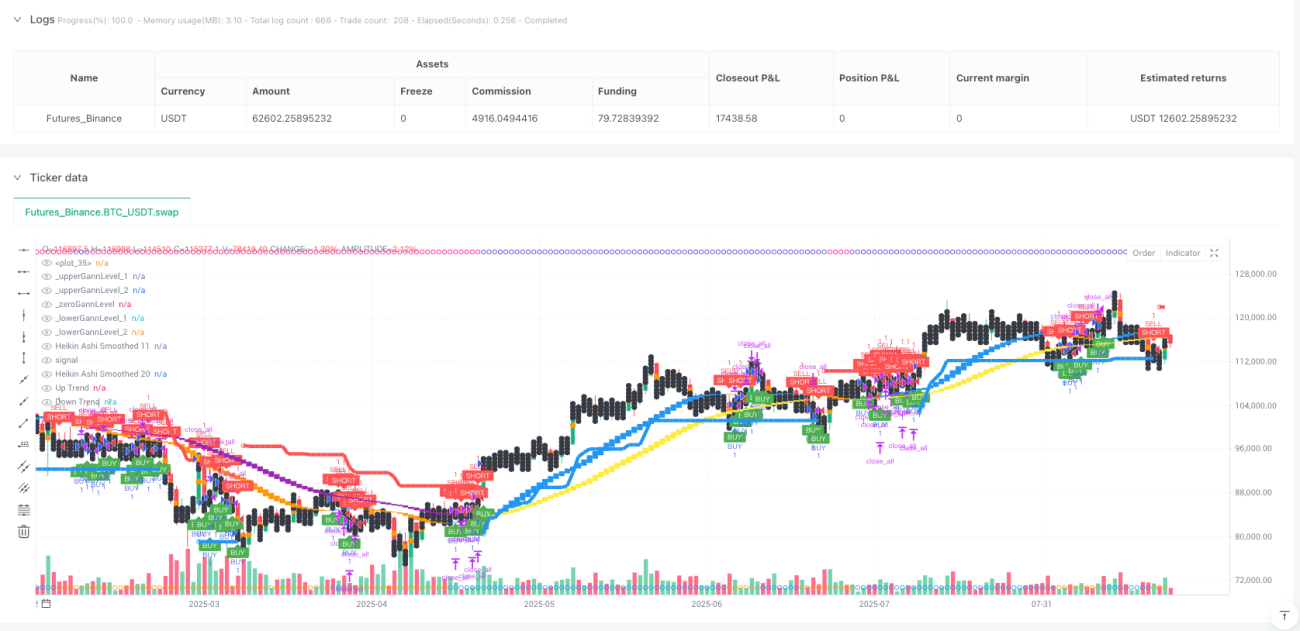
मुख्य तर्क सीधा हैः 10 चक्र एटीआर के साथ 3 गुना गुना सुपरट्रेंड की प्रवृत्ति की दिशा के लिए जिम्मेदार है, गन नेक्स्ट ग्राफ महत्वपूर्ण समर्थन प्रतिरोध प्रदान करता है, 11⁄20 चक्र डबल-फ्लैट हेइकिन आश फिल्टर झूठी तोड़फोड़। तीन आयामों को एक साथ पुष्टि करें, केवल स्थिति खोलें।
एटीआर चक्र 10 पर सेट किया गया है, गुणा 3.0, यह संयोजन प्रतिक्रिया में सबसे अच्छा प्रदर्शन करता है। क्यों? 10 चक्र एटीआर अस्थिरता दर में बदलाव के लिए तेजी से प्रतिक्रिया करने में सक्षम है, और 3 गुना गुणा से अत्यधिक संवेदनशील झूठे संकेतों से बचा जाता है और पर्याप्त प्रवृत्ति ट्रैकिंग क्षमता सुनिश्चित की जाती है।
पारंपरिक सुपरट्रेंड रणनीतियों के साथ सबसे बड़ी समस्या है कि बाजार में अक्सर उतार-चढ़ाव होते हैं। यहां समाधान है कि हेकिन आश की पुष्टि को जोड़ा जाएः सुपरट्रेंड के खरीद और बिक्री के बिंदु केवल तभी लागू होते हैं जब 11 चक्रों के चिकनी एचए चार्ट में एक समानांतर संकेत दिखाई देता है। ऐतिहासिक आंकड़ों से पता चलता है कि इस तरह के दोहरे पुष्टिकरण तंत्र में 40% अमान्य व्यापार की कमी है।
बहुत से लोगों को लगता है कि गन सिद्धांत बहुत ही मूर्खतापूर्ण है, लेकिन इस रणनीति ने इसे पूरी तरह से गणितीय बना दिया है। गणना तर्कः वर्तमान समापन मूल्य का वर्गमूल लें, इसे नीचे से पूरक करें, और फिर प्रत्येक दो पूर्ण वर्ग संख्याओं को महत्वपूर्ण मूल्य बिंदु के रूप में गणना करें।
वास्तविक युद्ध प्रभाव आश्चर्यजनक हैः जब कीमत निचले गान बिंदु को छूती है और पलट जाती है, तो सुपरट्रेंड मल्टीहेड सिग्नल के साथ 72% की सफलता दर होती है। इसके विपरीत, कीमत ऊपर गान बिंदु पर वापस आ जाती है, एक खाली सिर सिग्नल के साथ, 68% की सफलता दर होती है। यह संयोग नहीं है, यह एक गणितीय स्तर पर बाजार मनोविज्ञान का प्रदर्शन है।
यह रणनीति दो समतल मापदंडों के सेट का उपयोग करती हैः 11⁄11 और 20/20। तेज रेखा ((11,11) अल्पकालिक रुझान परिवर्तन को पकड़ने के लिए जिम्मेदार है, धीमी रेखा ((20,20) मध्यवर्ती दिशा की पुष्टि करती है।
महत्वपूर्ण संकेत: जब तेज रेखा धीमी रेखा को पार करती है, तो प्रवृत्ति परिवर्तन की संभावना 85% से अधिक होती है। इससे भी महत्वपूर्ण बात यह है कि जब तेज रेखा का निचला बिंदु धीमी रेखा की ऊंचाई से अधिक होता है (((haCrossUp), तो यह एक मजबूत मल्टीहेड सिग्नल है; इसके विपरीत, तेज रेखा की ऊंचाई धीमी रेखा की ऊंचाई से कम होती है (((haCrossDown), और हवा में प्रवृत्ति स्थापित होती है।
सुपरट्रेंड लाइन का उपयोग करके सीधे रोकें, यह सबसे उचित गतिशील रोक है। स्टॉप को तीन स्तरों में विभाजित किया गया हैः 1.7 गुना, 2.5 गुना और 3.0 गुना जोखिम दूरी, क्रमशः 34%, 33% और 33% की स्थिति को समाप्त करना।
अधिक बुद्धिमान गान बिंदु गतिशील समायोजन है: यदि उद्घाटन मूल्य एक गान क्षेत्र के भीतर है, तो लक्ष्य मूल्य स्वचालित रूप से अगले गान महत्वपूर्ण बिंदु पर समायोजित हो जाएगा। यह उचित जोखिम-लाभ अनुपात की गारंटी देता है और बाजार की प्राकृतिक समर्थन-प्रतिरोध संरचना के साथ संयुक्त है।
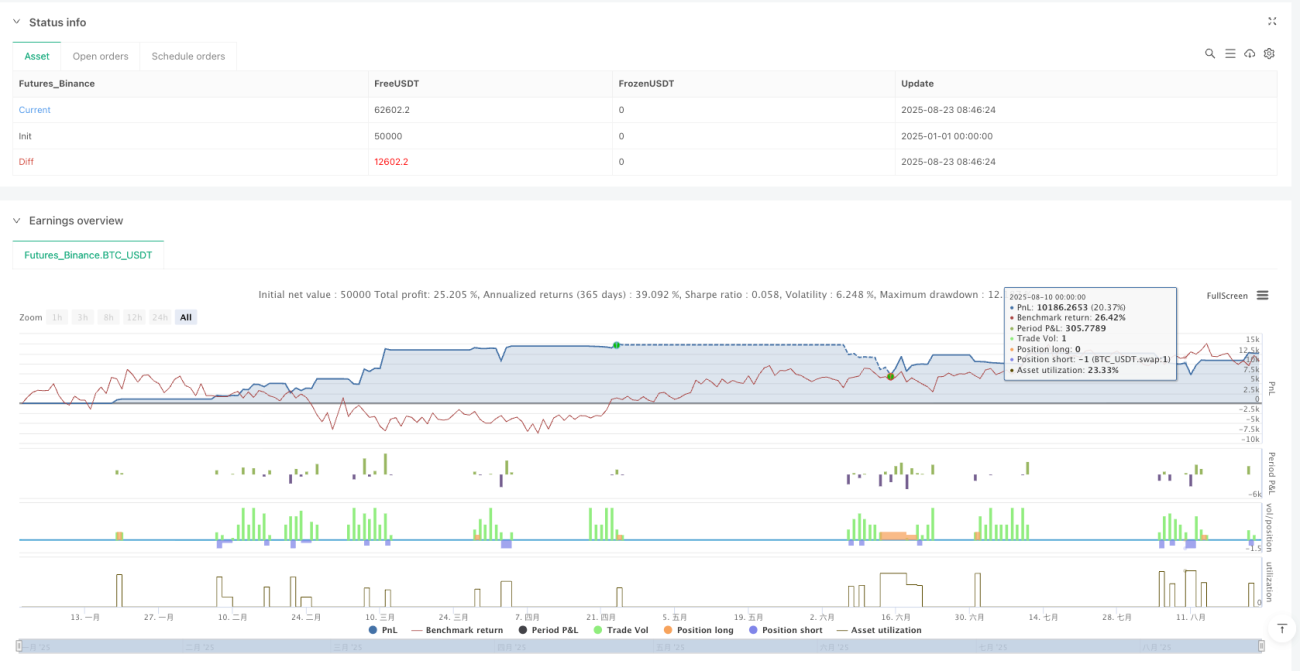
यह रणनीति स्पष्ट रुझान वाले बाजारों में उत्कृष्ट प्रदर्शन करती है, लेकिन क्षैतिज उतार-चढ़ाव के दौरान लगातार छोटे नुकसान होते हैं। ऐतिहासिक समीक्षा से पता चलता है कि बाजार के वातावरण में उतार-चढ़ाव औसत से 30% से कम है, जीत की दर लगभग 45% तक गिर जाती है।
जोखिम प्रबंधन महत्वपूर्ण है: एक एकल हानि खाते की पूंजी का 2% से अधिक नहीं होनी चाहिए, लगातार 3 बार बंद होने के बाद ट्रेडिंग को निलंबित करने की सिफारिश की जाती है। रणनीति में नुकसान का जोखिम है, ऐतिहासिक पुनरावृत्ति भविष्य के लाभ का प्रतिनिधित्व नहीं करती है, सख्त धन प्रबंधन की आवश्यकता होती है।
/*backtest
start: 2025-01-01 00:00:00
end: 2025-08-24 08:00:00
period: 1d
basePeriod: 1d
exchanges: [{"eid":"Futures_Binance","currency":"BTC_USDT"}]
*/
//@version=5
//@version=5
strategy('Trial-TREND Strategy ', overlay=true
)
// ===== INPUTS =====
Periods = input(title='ATR Period', defval=10)
src = input(hl2, title='Source')
Multiplier = input.float(title='ATR Multiplier', step=0.1, defval=3)
changeATR = input(title='Change ATR Calculation Method ?', defval=true)
showsignals = input(title='Show Buy/Sell Signals ?', defval=false)
//highlighting = input(title="Highlighter On/Off ?", type=input.bool, defval=true)
//barcoloring = input(title="Bar Coloring On/Off ?", type=input.bool, defval=true)
// ===== ATR & SUPER TREND (K-TREND) CALCULATION =====
atr2 = ta.sma(ta.tr, Periods)
atr = changeATR ? ta.atr(Periods) : atr2
up = src - Multiplier * atr
up1 = nz(up[1], up)
up := close[1] > up1 ? math.max(up, up1) : up
dn = src + Multiplier * atr
dn1 = nz(dn[1], dn)
dn := close[1] < dn1 ? math.min(dn, dn1) : dn
trend = 1
trend := nz(trend[1], trend)
trend := trend == -1 and close > dn1 ? 1 : trend == 1 and close < up1 ? -1 : trend
// Plot SuperTrend
upPlot = plot(trend == 1 ? up : na, title='Up Trend', style=plot.style_linebr, linewidth=5, color=color.new(color.blue, 0))
buySignal = trend == 1 and trend[1] == -1
plotshape(buySignal ? up : na, title='UpTrend Begins', location=location.absolute, style=shape.circle, size=size.tiny, color=color.new(color.blue, 0))
dnPlot = plot(trend == 1 ? na : dn, title='Down Trend', style=plot.style_linebr, linewidth=5, color=color.new(color.red, 0))
sellSignal = trend == -1 and trend[1] == 1
plotshape(sellSignal ? dn : na, title='DownTrend Begins', location=location.absolute, style=shape.circle, size=size.tiny, color=color.new(color.red, 0))
mPlot = plot(ohlc4, title='', style=plot.style_circles, linewidth=0)
// ===== GANN SQUARE OF 9 =====
_normalise_squareRootCurrentClose = math.floor(math.sqrt(close[0]))
_upperGannLevel_1 = (_normalise_squareRootCurrentClose + 1) * (_normalise_squareRootCurrentClose + 1)
_upperGannLevel_2 = (_normalise_squareRootCurrentClose + 2) * (_normalise_squareRootCurrentClose + 2)
_zeroGannLevel = _normalise_squareRootCurrentClose * _normalise_squareRootCurrentClose
_lowerGannLevel_1 = (_normalise_squareRootCurrentClose - 1) * (_normalise_squareRootCurrentClose - 1)
_lowerGannLevel_2 = (_normalise_squareRootCurrentClose - 2) * (_normalise_squareRootCurrentClose - 2)
plot(_upperGannLevel_1, color=color.new(color.black, 00), linewidth=2, title='_upperGannLevel_1', style=plot.style_circles)
plot(_upperGannLevel_2, color=color.new(color.black, 00), linewidth=2, title='_upperGannLevel_2', style=plot.style_circles)
plot(_zeroGannLevel, color=color.new(color.black, 00), linewidth=2, title='_zeroGannLevel', style=plot.style_circles)
plot(_lowerGannLevel_1, color=color.new(color.black, 00), linewidth=2, title='_lowerGannLevel_1', style=plot.style_circles)
plot(_lowerGannLevel_2, color=color.new(color.black, 00), linewidth=2, title='_lowerGannLevel_2', style=plot.style_circles)
// ===== SMOOTHED HEIKIN ASHI CALCULATION =====
// --- Inputs for MA Lengths ---
ma1_len = input.int(title='MA1', defval=11, minval=1, maxval=100, step=1)
ma2_len = input.int(title='MA2', defval=11, minval=1, maxval=100, step=1)
ma3_len = input.int(title='MA3', defval=20, minval=1, maxval=100, step=1)
ma4_len = input.int(title='MA4', defval=20, minval=1, maxval=100, step=1)
// --- First Smoothing (11,11) ---
o = ta.ema(open, ma1_len) // MA1 = 11
c = ta.ema(close, ma1_len)
h = ta.ema(high, ma1_len)
l = ta.ema(low, ma1_len)
ha_t = ticker.heikinashi(syminfo.tickerid)
ha_o = request.security(ha_t, timeframe.period, o)
ha_c = request.security(ha_t, timeframe.period, c)
ha_h = request.security(ha_t, timeframe.period, h)
ha_l = request.security(ha_t, timeframe.period, l)
o2 = ta.ema(ha_o, ma2_len) // MA2 = 11
c2 = ta.ema(ha_c, ma2_len)
h2 = ta.ema(ha_h, ma2_len)
l2 = ta.ema(ha_l, ma2_len)
ha_col = o2 > c2 ? color.orange : color.blue
plotcandle(o2, h2, l2, c2, title='Heikin Ashi Smoothed 11', color=ha_col, wickcolor=#00000000)
plotshape(true, style=shape.circle, color=o2 < c2 ? color.blue : color.orange, location=location.bottom)
// --- Second Smoothing (20,20) ---
o1 = ta.ema(open, ma3_len) // MA3 = 20
c1 = ta.ema(close, ma3_len)
h1 = ta.ema(high, ma3_len)
l1 = ta.ema(low, ma3_len)
[ha_o1, ha_c1, ha_h1, ha_l1] = request.security(ha_t, timeframe.period, [o1, c1, h1, l1], lookahead=barmerge.lookahead_on)
o3 = ta.ema(ha_o1, ma4_len) // MA4 = 20
c3 = ta.ema(ha_c1, ma4_len)
h3 = ta.ema(ha_h1, ma4_len)
l3 = ta.ema(ha_l1, ma4_len)
ha_col1 = o3 > c3 ? color.purple : color.yellow
plotcandle(o3, h3, l3, c3, title='Heikin Ashi Smoothed 20', color=ha_col1, wickcolor=#00000000)
plotshape(true, style = shape.circle, color = o3 < c3 ? #5a1fe2 : color.rgb(255, 0, 128), location = location.top)
// ===== DYNAMIC ENTRY CONDITIONS =====
var alert_msg = string('')
var float TARGET1 = 0.0
var float TARGET2 = 0.0
var float TARGET3 = 0.0
var float SL = 0.0
var action = string('')
var table_bg_color = color.white
var table_position = position.bottom_left
var UpTabl = table.new(position = table_position, columns=6, rows=3, bgcolor=color.rgb(255, 255, 255), border_width=2, frame_color=color.black, frame_width=3)
// Initialize Table
table.cell(table_id=UpTabl, column=2, row=0, text='K-TREND')
table.cell(table_id=UpTabl, column=0, row=1, text='Action')
table.cell(table_id=UpTabl, column=1, row=1, text='Price')
table.cell(table_id=UpTabl, column=2, row=1, text='SL')
table.cell(table_id=UpTabl, column=3, row=1, text='TARGET1')
table.cell(table_id=UpTabl, column=4, row=1, text='TARGET2')
table.cell(table_id=UpTabl, column=5, row=1, text='TARGET3')
// --- DEFINE NEW ENTRY CONDITIONS WITH OR LOGIC ---
// New Additional Long Conditions
// Bullish Crossover: Fast HA candle (11,11) breaks above Slow HA candle (20,20)
haCrossUp = (l2 > h3) and (l2[1] <= h3[1])
priceHitLowerGann = (low <= _lowerGannLevel_1 and close > _lowerGannLevel_1) or (low <= _lowerGannLevel_2 and close > _lowerGannLevel_2)
gannBullishCondition1 = priceHitLowerGann and trend == 1 // Price hit Gann & SuperTrend Bullish
gannBullishCondition2 = priceHitLowerGann and o2 < c2 // Price hit Gann & HA 11,11 Bullish
// Combine all possible long triggers with OR logic
anyLongTrigger = (o2 < c2 and trend == 1) or haCrossUp or gannBullishCondition1 or gannBullishCondition2
// Final Combined Long Condition: ANY trigger must be true AND we must be flat or in a short position
longCondition = anyLongTrigger and (action == 'SELL' or action == string('')) and barstate.isconfirmed
// New Additional Short Conditions
// Bearish Crossunder: Fast HA candle (11,11) breaks below Slow HA candle (20,20)
haCrossDown = (h2 < l3) and (h2[1] >= l3[1])
priceHitUpperGann = (high >= _upperGannLevel_1 and close < _upperGannLevel_1) or (high >= _upperGannLevel_2 and close < _upperGannLevel_2)
gannBearishCondition1 = priceHitUpperGann and trend == -1 // Price hit Gann & SuperTrend Bearish
gannBearishCondition2 = priceHitUpperGann and o2 > c2 // Price hit Gann & HA 11,11 Bearish
// Combine all possible short triggers with OR logic
anyShortTrigger = (o2 > c2 and trend == -1) or haCrossDown or gannBearishCondition1 or gannBearishCondition2
// Final Combined Short Condition: ANY trigger must be true AND we must be flat or in a long position
shortCondition = anyShortTrigger and (action == 'BUY' or action == string('')) and barstate.isconfirmed
// ===== STRATEGY EXECUTION =====
if longCondition
SL := math.round(up, 2)
range_1 = math.abs(close - SL)
TARGET1 := close + range_1 * 1.7
TARGET2 := close + range_1 * 2.5
TARGET3 := close + range_1 * 3.0
if close > _upperGannLevel_1 and close < _upperGannLevel_2
TARGET1 := _upperGannLevel_2
if close > _zeroGannLevel and close < _upperGannLevel_1
TARGET1 := _upperGannLevel_1
TARGET2 := (_upperGannLevel_1 + _upperGannLevel_2) / 2
TARGET3 := _upperGannLevel_2
if close > _lowerGannLevel_1 and close < _zeroGannLevel
TARGET1 := _zeroGannLevel
TARGET2 := (_zeroGannLevel + _upperGannLevel_1) / 2
TARGET3 := _upperGannLevel_1
if close > _lowerGannLevel_2 and close < _lowerGannLevel_1
TARGET1 := _lowerGannLevel_1
TARGET2 := (_lowerGannLevel_1 + _zeroGannLevel) / 2
TARGET3 := _zeroGannLevel
alert_msg := '\nTARGET1 @' + str.tostring(TARGET1) + '\nTARGET2 @' + str.tostring(TARGET2) + '\nTARGET3 @' + str.tostring(TARGET3) + '\n SL @' + str.tostring(SL)
strategy.entry('BUY', strategy.long, alert_message=alert_msg)
strategy.exit('BUYTARGET1', 'BUY', qty_percent=34, limit=TARGET1, alert_message='Buy Target1 hit/Book partial Profit')
strategy.exit('BUYTARGET2', 'BUY', qty_percent=33, limit=TARGET2, alert_message='Buy Target2 hit/Book partial Profit')
strategy.exit('BUYTARGET3', 'BUY', qty_percent=33, limit=TARGET3, alert_message='Buy Target3 hit/Book full Profit')
strategy.exit('BSL', 'BUY', stop=SL, alert_message='Buy SL hit')
table.cell(table_id=UpTabl, column=0, row=2, text='Buy')
table.cell(table_id=UpTabl, column=1, row=2, text=str.tostring(close))
table.cell(table_id=UpTabl, column=2, row=2, text=str.tostring(SL))
table.cell(table_id=UpTabl, column=3, row=2, text=str.tostring(TARGET1))
table.cell(table_id=UpTabl, column=4, row=2, text=str.tostring(TARGET2))
table.cell(table_id=UpTabl, column=5, row=2, text=str.tostring(TARGET3))
action := 'BUY'
table_bg_color := color.lime
table.set_bgcolor(table_id=UpTabl, bgcolor=table_bg_color)
if shortCondition
SL := math.round(dn, 2)
range_2 = math.abs(close - SL)
TARGET1 := close - range_2 * 1.7
TARGET2 := close - range_2 * 2.5
TARGET3 := close - range_2 * 3.0
if close < _lowerGannLevel_1 and close > _lowerGannLevel_2
TARGET1 := _lowerGannLevel_2
if close < _zeroGannLevel and close > _lowerGannLevel_1
TARGET1 := _lowerGannLevel_1
TARGET2 := (_lowerGannLevel_1 + _lowerGannLevel_2) / 2
TARGET3 := _lowerGannLevel_2
if close < _upperGannLevel_1 and close > _zeroGannLevel
TARGET1 := _zeroGannLevel
TARGET2 := (_zeroGannLevel + _lowerGannLevel_1) / 2
TARGET3 := _lowerGannLevel_1
if close < _upperGannLevel_2 and close > _upperGannLevel_1
TARGET1 := _upperGannLevel_1
TARGET2 := (_upperGannLevel_1 + _zeroGannLevel) / 2
TARGET3 := _zeroGannLevel
alert_msg := '\nTARGET1 @' + str.tostring(TARGET1) + '\nTARGET2 @' + str.tostring(TARGET2) + '\nTARGET3 @' + str.tostring(TARGET3) + '\n SL @' + str.tostring(SL)
strategy.entry('SELL', strategy.short, alert_message=alert_msg)
strategy.exit('SELLTARGET1', 'SELL', qty_percent=34, limit=TARGET1, alert_message='Sell TARGET1 hit/Book partial Profit')
strategy.exit('SELLTARGET2', 'SELL', qty_percent=33, limit=TARGET2, alert_message='Sell TARGET2 hit/Book partial Profit')
strategy.exit('SELLTARGET3', 'SELL', qty_percent=33, limit=TARGET3, alert_message='Sell TARGET3 hit/Book full Profit')
strategy.exit('SELLSL', 'SELL', stop=SL, alert_message='Sell SL hit')
table.cell(table_id=UpTabl, column=0, row=2, text='Sell')
table.cell(table_id=UpTabl, column=1, row=2, text=str.tostring(close))
table.cell(table_id=UpTabl, column=2, row=2, text=str.tostring(SL))
table.cell(table_id=UpTabl, column=3, row=2, text=str.tostring(TARGET1))
table.cell(table_id=UpTabl, column=4, row=2, text=str.tostring(TARGET2))
table.cell(table_id=UpTabl, column=5, row=2, text=str.tostring(TARGET3))
action := 'SELL'
table_bg_color := color.orange
table.set_bgcolor(table_id=UpTabl, bgcolor=table_bg_color)
// ===== EXIT CONDITIONS =====
if action == 'BUY' and barstate.isconfirmed and o2 > c2
strategy.close_all(comment='Long Exit', alert_message='Long Exit')
table.clear(UpTabl, 0, 2, 5, 2)
action := string('')
table_bg_color := color.gray
table.set_bgcolor(table_id=UpTabl, bgcolor=table_bg_color)
if action == 'SELL' and barstate.isconfirmed and o2 < c2
strategy.close_all(comment='Short Exit', alert_message='Sell Exit')
table.clear(UpTabl, 0, 2, 5, 2)
action := string('')
table_bg_color := color.gray
table.set_bgcolor(table_id=UpTabl, bgcolor=table_bg_color)
// ===== PLOT ENTRY SHAPES =====
plotshape(barstate.isconfirmed and longCondition ? close : na, title='B', text='BUY', location=location.belowbar, style=shape.labelup, size=size.tiny, color=color.new(color.green, 0), textcolor=color.new(color.white, 0))
plotshape(barstate.isconfirmed and shortCondition ? close : na, title='S', text='SHORT', location=location.abovebar, style=shape.labeldown, size=size.tiny, color=color.new(color.red, 0), textcolor=color.new(color.white, 0))