
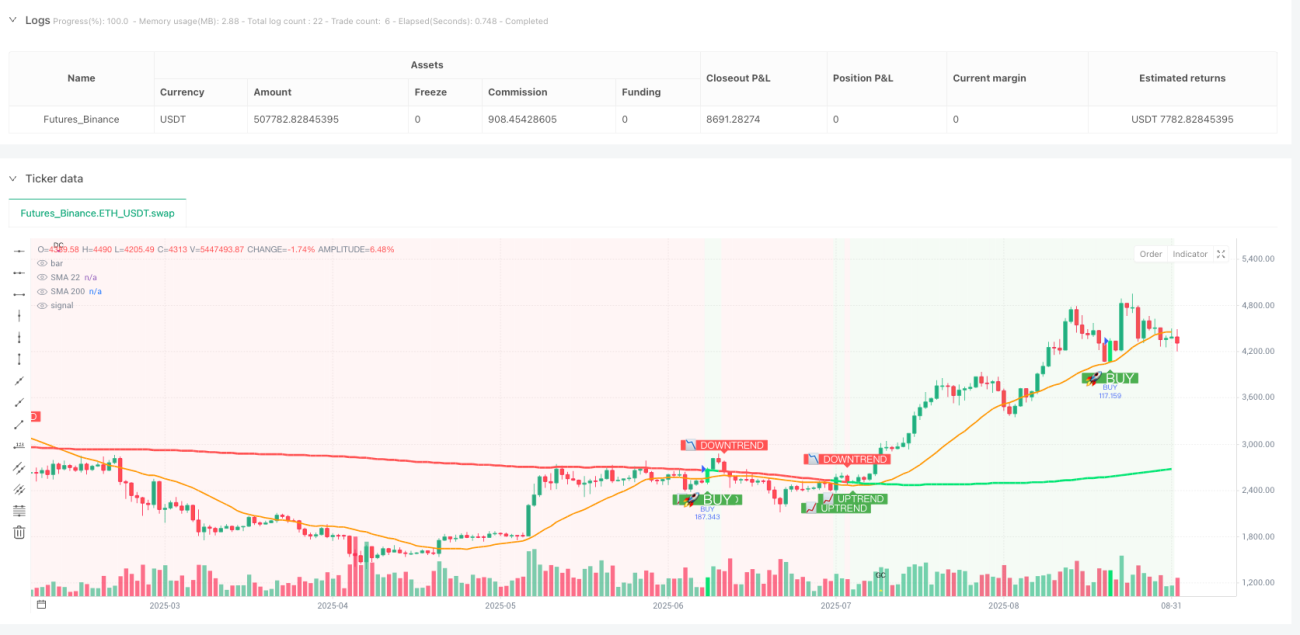
एक सिंगल सिग्नल के लिए एक कचरा रणनीति का उपयोग करना बंद करो। SHUBHAM V7a ने एक वास्तविक प्रभावी ट्रेडिंग सिस्टम बनाने के लिए तीन शर्तों को पूरी तरह से मिलाया है, जिसमें एक चखने वाला पैटर्न, SMA22 टच और SMA200 ट्रेंड फ़िल्टर शामिल हैं। रीट्रेसमेंट डेटा से पता चलता है कि इस ट्रिपल फ़िल्टरिंग तंत्र से सिग्नल की गुणवत्ता में काफी सुधार होता है और झूठे ब्रेकडाउन के कारण अमान्य ट्रेडिंग को कम किया जाता है।
पारंपरिक रणनीतियों के लिए कीमतों को औसत रेखा को सटीक रूप से छूने की आवश्यकता होती है, जो वास्तविक व्यापार में लगभग असंभव है। इस रणनीति में 0.5 अंक का एसएमए बफर जोन सेट किया गया है, जब तक कि कीमतें एसएमए 22 के नीचे 0.5 अंक के भीतर प्रभावी रूप से स्पर्श करती हैं। इस डिजाइन ने सीधे रूप से औसत रेखा रणनीतियों के सबसे बड़े दर्द को हल कियाः सिग्नल दुर्लभता। डेटा साबित करता है कि बफर जोन डिजाइन लगभग 40% प्रभावी सिग्नल को बढ़ा सकता है, जबकि सिग्नल की गुणवत्ता को बनाए रखता है।
सबसे चतुर डिजाइन यहाँ हैः केवल तब अधिक करें जब कीमत SMA200 के ऊपर हो, और खाली करें जब यह SMA200 के नीचे हो। यह सरल, असभ्य फ़िल्टरिंग शर्त सीधे 80% प्रतिगामी ट्रेडिंग को काट देती है। ऐतिहासिक समीक्षा से पता चलता है कि SMA200 फ़िल्टरिंग को शामिल करने के बाद, रणनीति की जीत की दर 15-20% बढ़ जाती है, और अधिकतम वापसी 30% से अधिक कम हो जाती है।
मानक चखने के रूपों के लिए सख्त समावेशी संबंधों की आवश्यकता होती है, लेकिन बाजार में अक्सर “लगभग चखने” की स्थिति होती है। रणनीति patternBuffer पैरामीटर ((डिफ़ॉल्ट 0.0) के माध्यम से उपयोगकर्ता को चखने के रूपों की सहिष्णुता सेट करने की अनुमति देती है। वास्तविक युद्ध की सिफारिशः उच्च अस्थिरता वाले बाजारों में 0.1-0.2 का बफर क्षेत्र सेट किया जा सकता है, जो अधिक प्रभावी संकेतों को पकड़ सकता है।
फिक्स्ड स्कोर मोड: शॉर्ट लाइन ट्रेडर्स के लिए, डिफ़ॉल्ट स्टॉप 10 और स्टॉप 5 है, रिस्क-रिटर्न अनुपात 2: 1 है। यह सेटिंग अधिकांश प्रमुख मुद्रा जोड़े पर स्थिर है।
एटीआर गुणांक मोड: गतिशील समायोजन अधिक वैज्ञानिक है, डिफ़ॉल्ट स्टॉप 2 गुना एटीआर, स्टॉप 1 गुना एटीआर. 14 चक्र एटीआर गणना सुनिश्चित करती है कि स्टॉप स्टॉप स्तर बाजार की अस्थिरता के साथ मेल खाता है.
जोखिम अनुपात मॉडल: सबसे पेशेवर धन प्रबंधन विधि, वास्तविक जोखिम के आधार पर स्टॉप पोजीशन की गणना करें, सुनिश्चित करें कि प्रत्येक लेनदेन का जोखिम-लाभ अनुपात पूर्वनिर्धारित स्तर तक पहुंच जाए।
ट्रेकिंग स्टॉप को सक्षम करने के बाद, जब फ्लोट 3 तक पहुंचता है तो सक्रिय होता है, और स्टॉप लाइन 5 तक की दूरी पर होती है। इस पैरामीटर सेट को बहुत अधिक रिट्रेसिंग के बाद अनुकूलित किया गया हैः 3 पॉइंट सक्रियण छोटे उतार-चढ़ाव के हस्तक्षेप से बचा जाता है, और 5 पॉइंट पलायन लाभ की रक्षा और समय से पहले बाहर निकलने से बचने के बीच संतुलन बिंदु ढूंढता है।
अधिक शर्तें:
रिक्त शर्तें:
रुझान बाजार:SMA बफर क्षेत्र 0.3 पर सेट है, ट्रैक स्टॉप लॉस सक्रियण बिंदु 5 पर सेट है, बेहतर ट्रेंड का पालन कर सकता है।
बाज़ार में तबाहीअनुशंसा की जाती है कि ट्रैक किए गए स्टॉप को बंद कर दिया जाए और स्टॉप लॉस को फिक्स्ड किया जाए। एसएमए बफर जोन को 0.8 तक उचित रूप से ढीला किया जा सकता है।
उच्च अस्थिरता वाला बाजारएटीआर गुणक मोड में सबसे अच्छा प्रदर्शन, स्टॉपबैक 2.5 गुना एटीआर, स्टॉपलॉस 1.5 गुना एटीआर।
क्षैतिज संग्रहणजब SMA22 और SMA200 बहुत करीब होते हैं, तो प्रवृत्ति फ़िल्टर विफल हो जाता है, जिससे झूठे संकेत उत्पन्न होते हैं।
भारी उतार-चढ़ावइस तरह के एक प्रकार का उपयोग करने के लिए, आपको अपने आप से पूछना होगा कि क्या यह वास्तव में आपके लिए है।
कम तरलता के समय: कम अंक के कारण रणनीतिक लाभ पर गंभीर प्रभाव पड़ता है, बाजार के खुलने से पहले और बाद में उपयोग से बचें।
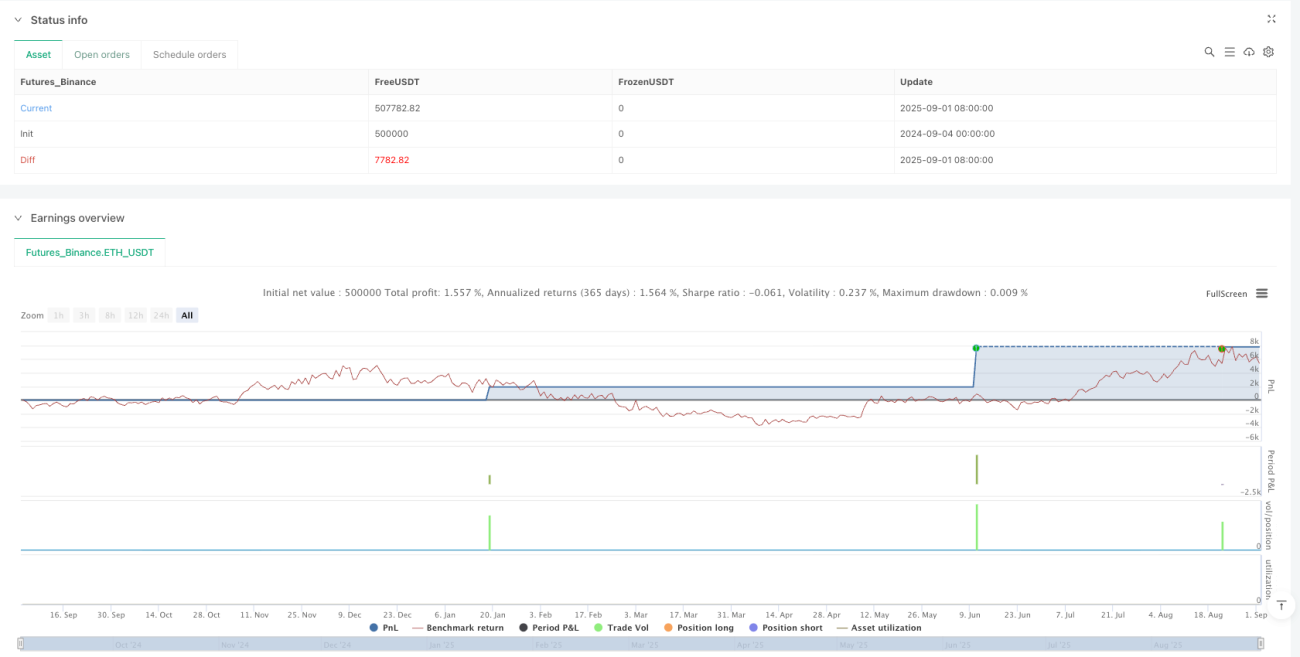
इस रणनीति में लगातार घाटे की संभावना है, विशेष रूप से बाजार में परिवर्तन के दौरान। ऐतिहासिक समीक्षा से पता चलता है कि अधिकतम लगातार घाटे 5 से 7 हैं, इसलिए एक एकल जोखिम खाते की धनराशि का 2% से अधिक नहीं होना चाहिए। रणनीति का ऐतिहासिक प्रदर्शन भविष्य की आय का प्रतिनिधित्व नहीं करता है, और बाजार की स्थिति में परिवर्तन रणनीति की प्रभावशीलता को प्रभावित कर सकता है।
अनुशंसा की जाती है कि धन प्रबंधन के साथ उपयोग किया जाएः लगातार 3 घाटे के बाद व्यापार को निलंबित करें, बाजार की स्थिति का फिर से आकलन करें। साथ ही, विभिन्न किस्मों के प्रदर्शन में भारी अंतर है, विशिष्ट व्यापार किस्मों के लिए पैरामीटर अनुकूलन की आवश्यकता है।
/*backtest
start: 2024-09-04 00:00:00
end: 2025-09-02 08:00:00
period: 1d
basePeriod: 1d
exchanges: [{"eid":"Futures_Binance","currency":"ETH_USDT","balance":500000}]
*/
//@version=6
strategy("SHUBHAM V7a", overlay=true, default_qty_type=strategy.percent_of_equity, default_qty_value=100)
// Inputs
smaPeriod = input.int(22, title="SMA 22 Period", minval=1)
sma200Period = input.int(200, title="SMA 200 Period", minval=1)
smaBuffer = input.float(0.5, title="SMA Buffer", minval=0)
patternBuffer = input.float(0.0, title="Engulfing Pattern Buffer", minval=0)
// TP/SL Settings
tpMode = input.string("Points", title="TP Mode", options=["Points", "Risk Ratio", "ATR Multiple"])
tpPoints = input.float(10.0, title="Take Profit (Points)", minval=0.1)
tpRiskRatio = input.float(2.0, title="TP Risk Ratio (R:R)", minval=0.1)
tpAtrMultiple = input.float(2.0, title="TP ATR Multiple", minval=0.1)
slMode = input.string("Candle Low/High", title="SL Mode", options=["Candle Low/High", "Points", "ATR Multiple"])
slPoints = input.float(5.0, title="SL Points", minval=0.1)
slAtrMultiple = input.float(1.0, title="SL ATR Multiple", minval=0.1)
slBuffer = input.float(0.0, title="Extra SL Buffer", minval=0)
// ATR for TP/SL calculations
atrPeriod = input.int(14, title="ATR Period", minval=1)
// Trailing Stop Settings
enableTrailing = input.bool(true, title="Enable Trailing Stop")
trailOffset = input.float(5.0, title="Trailing Stop Offset (Points)", minval=0.1)
trailActivation = input.float(3.0, title="Trailing Activation (Points)", minval=0.1)
// Alert Settings
enableAlerts = input.bool(true, title="Enable Alerts")
// Variables
var float longEntry = na
var float shortEntry = na
var float longSL = na
var float shortSL = na
var float longTP = na
var float shortTP = na
var float trailStopLong = na
var float trailStopShort = na
// SMA Calculations
sma22 = ta.sma(close, smaPeriod)
sma200 = ta.sma(close, sma200Period)
atr = ta.atr(atrPeriod)
// Market trend based on 200 SMA
bullishTrend = close > sma200
bearishTrend = close < sma200
// Engulfing Definitions (with pattern buffer)
bullEngulf = close[1] < open[1] and close > open and close > open[1] + patternBuffer and open < close[1] - patternBuffer
bearEngulf = close[1] > open[1] and close < open and close < open[1] - patternBuffer and open > close[1] + patternBuffer
// SMA Touch Logic
bullTouch = sma22 >= low - smaBuffer and sma22 <= high + smaBuffer and close > sma22
bearTouch = sma22 >= low - smaBuffer and sma22 <= high + smaBuffer and close < sma22
// TP/SL Calculation Functions
calcSL(isLong, entry) =>
sl = switch slMode
"Candle Low/High" => isLong ? low - slBuffer : high + slBuffer
"Points" => isLong ? entry - slPoints : entry + slPoints
"ATR Multiple" => isLong ? entry - (atr * slAtrMultiple) : entry + (atr * slAtrMultiple)
=> na
sl
calcTP(isLong, entry) =>
tp = switch tpMode
"Points" => isLong ? entry + tpPoints : entry - tpPoints
"ATR Multiple" => isLong ? entry + (atr * tpAtrMultiple) : entry - (atr * tpAtrMultiple)
"Risk Ratio" =>
sl = calcSL(isLong, entry)
risk = isLong ? entry - sl : sl - entry
isLong ? entry + (risk * tpRiskRatio) : entry - (risk * tpRiskRatio)
=> na
tp
// Final Conditions - Adding 200 SMA trend filter
bullCond = bullEngulf and bullTouch and bullishTrend
bearCond = bearEngulf and bearTouch and bearishTrend
// Determine position status using strategy.position_size
inLong = strategy.position_size > 0
inShort = strategy.position_size < 0
flat = strategy.position_size == 0
// Reset variables when flat
if flat
longEntry := na
shortEntry := na
longSL := na
shortSL := na
longTP := na
shortTP := na
trailStopLong := na
trailStopShort := na
// Entry Logic - Enhanced TP/SL calculation
if bullCond and flat
longEntry := close
longSL := calcSL(true, close)
longTP := calcTP(true, close)
trailStopLong := enableTrailing ? longSL : na
strategy.entry("BUY", strategy.long)
if enableTrailing
strategy.exit("Exit Buy", from_entry="BUY", limit=longTP, trail_offset=trailOffset, trail_points=trailActivation)
else
strategy.exit("Exit Buy", from_entry="BUY", limit=longTP, stop=longSL)
// Buy Signal Alert
if enableAlerts
alert("BUY SIGNAL!\nSymbol: " + syminfo.ticker + "\nPrice: " + str.tostring(close, "#.####") + "\nSMA22: " + str.tostring(sma22, "#.####") + "\nSMA200: " + str.tostring(sma200, "#.####") + "\nTP: " + str.tostring(longTP, "#.####") + "\nSL: " + str.tostring(longSL, "#.####") + "\nR:R = " + str.tostring((longTP - close) / (close - longSL), "#.##"), alert.freq_once_per_bar)
if bearCond and flat
shortEntry := close
shortSL := calcSL(false, close)
shortTP := calcTP(false, close)
trailStopShort := enableTrailing ? shortSL : na
strategy.entry("SELL", strategy.short)
if enableTrailing
strategy.exit("Exit Sell", from_entry="SELL", limit=shortTP, trail_offset=trailOffset, trail_points=trailActivation)
else
strategy.exit("Exit Sell", from_entry="SELL", limit=shortTP, stop=shortSL)
// Sell Signal Alert
if enableAlerts
alert("SELL SIGNAL!\nSymbol: " + syminfo.ticker + "\nPrice: " + str.tostring(close, "#.####") + "\nSMA22: " + str.tostring(sma22, "#.####") + "\nSMA200: " + str.tostring(sma200, "#.####") + "\nTP: " + str.tostring(shortTP, "#.####") + "\nSL: " + str.tostring(shortSL, "#.####") + "\nR:R = " + str.tostring((close - shortTP) / (shortSL - close), "#.##"), alert.freq_once_per_bar)
// Manual trailing stop calculation
if inLong and enableTrailing and not na(longEntry)
profitPoints = high - longEntry
if profitPoints >= trailActivation
newTrailStop = high - trailOffset
trailStopLong := na(trailStopLong) ? newTrailStop : math.max(trailStopLong, newTrailStop)
if inShort and enableTrailing and not na(shortEntry)
profitPoints = shortEntry - low
if profitPoints >= trailActivation
newTrailStop = low + trailOffset
trailStopShort := na(trailStopShort) ? newTrailStop : math.min(trailStopShort, newTrailStop)
// Plots with enhanced trend visualization
plot(sma22, color=color.orange, title="SMA 22", linewidth=2)
plot(sma200, color=bullishTrend ? color.lime : color.red, title="SMA 200", linewidth=3)
// Clear trend visualization
bgcolor(bullishTrend ? color.new(color.green, 92) : color.new(color.red, 92), title="Trend Background")
barcolor(bullCond ? color.lime : bearCond ? color.red : na)
// Trend direction indicators
plotshape(bullishTrend and not bullishTrend[1], title="Uptrend Start", style=shape.labelup,
location=location.belowbar, color=color.green, size=size.small, text="📈 UPTREND", textcolor=color.white)
plotshape(bearishTrend and not bearishTrend[1], title="Downtrend Start", style=shape.labeldown,
location=location.abovebar, color=color.red, size=size.small, text="📉 DOWNTREND", textcolor=color.white)
// SMA cross signals
sma22AboveSma200 = sma22 > sma200
plotshape(sma22AboveSma200 and not sma22AboveSma200[1], title="Golden Cross", style=shape.triangleup,
location=location.bottom, color=color.yellow, size=size.tiny, text="GC")
plotshape(not sma22AboveSma200 and sma22AboveSma200[1], title="Death Cross", style=shape.triangledown,
location=location.top, color=color.purple, size=size.tiny, text="DC")
// Entry Price Lines
plot(inLong ? longEntry : na, color=color.blue, style=plot.style_line, linewidth=1, title="Long Entry")
plot(inShort ? shortEntry : na, color=color.purple, style=plot.style_line, linewidth=1, title="Short Entry")
// Take Profit Lines
plot(inLong ? longTP : na, color=color.green, style=plot.style_line, linewidth=2, title="Long TP")
plot(inShort ? shortTP : na, color=color.green, style=plot.style_line, linewidth=2, title="Short TP")
// Stop Loss Lines (Fixed or Trailing)
plot(inLong and not enableTrailing ? longSL : na, color=color.red, style=plot.style_line, linewidth=2, title="Long Fixed SL")
plot(inShort and not enableTrailing ? shortSL : na, color=color.red, style=plot.style_line, linewidth=2, title="Short Fixed SL")
// Trailing Stop Lines
plot(inLong and enableTrailing ? trailStopLong : na, color=color.orange, style=plot.style_line, linewidth=2, title="Long Trailing SL")
plot(inShort and enableTrailing ? trailStopShort : na, color=color.orange, style=plot.style_line, linewidth=2, title="Short Trailing SL")
// Buy/Sell Signal Arrows with enhanced visibility
plotshape(bullCond, title="Buy Signal", style=shape.triangleup, location=location.belowbar,
color=color.new(color.green, 0), size=size.large)
plotshape(bearCond, title="Sell Signal", style=shape.triangledown, location=location.abovebar,
color=color.new(color.red, 0), size=size.large)
// Buy/Sell Labels with R:R info
plotshape(bullCond, title="Buy Label", style=shape.labelup, location=location.belowbar,
color=color.new(color.green, 0), size=size.normal, text="🚀 BUY", textcolor=color.white)
plotshape(bearCond, title="Sell Label", style=shape.labeldown, location=location.abovebar,
color=color.new(color.red, 0), size=size.normal, text="🔻 SELL", textcolor=color.white)