फिबोनाची रिबाउंड शिकारी

यह केवल एक और सपोर्ट-रेजिस्टेंस स्ट्रेटेजी नहीं है, यह रिबाउंड पॉइंट्स को सटीक रूप से भेदने का गणितीय हथियार है
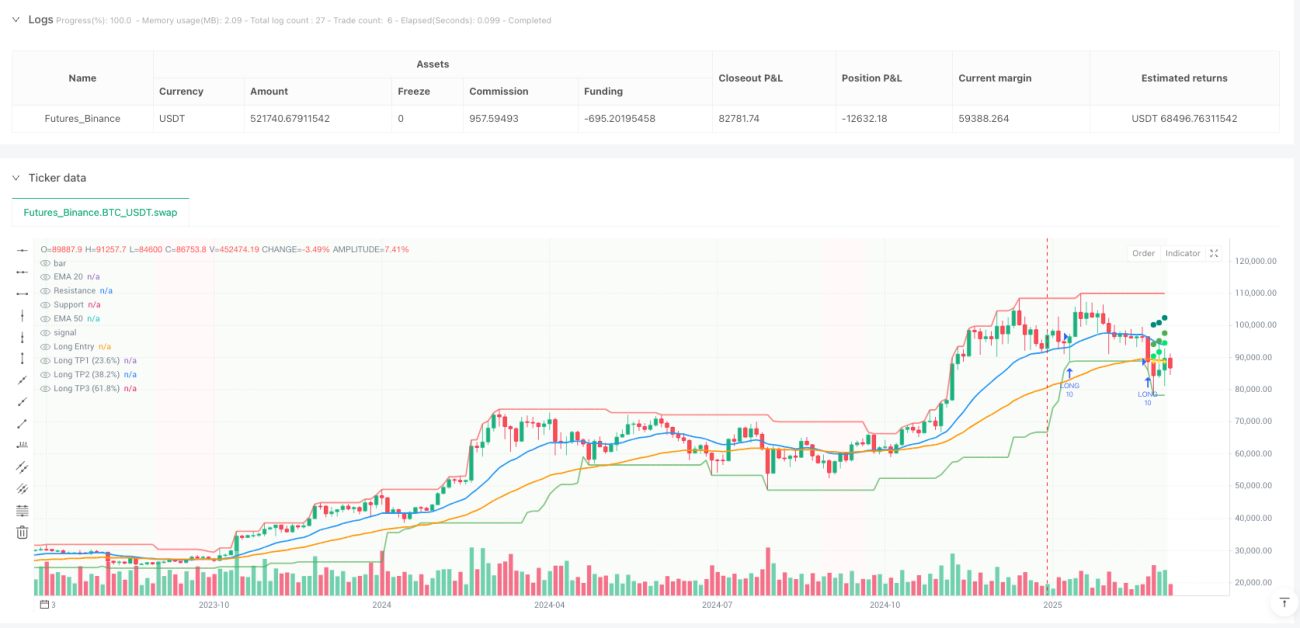
अब उन अस्पष्ट "सपोर्ट के पास खरीदें" वाली बातों का उपयोग न करें। यह रणनीति सपोर्ट और रेजिस्टेंस डिटेक्शन, ट्रेंड कन्फर्मेशन और फाइबोनैचि टार्गेट को पूरी तरह से एकीकृत करती है, जो आपको मात्रात्मक एंट्री पॉइंट और सटीक एग्जिट प्लान प्रदान करती है। 20-अवधि का EMA और 50-अवधि का EMA ट्रेंड की दिशा निर्धारित करते हैं, 3 कैंडल मजबूती वाले पिवट पॉइंट वास्तविक महत्वपूर्ण स्तरों की पहचान करते हैं, और 2x ATR स्टॉप-लॉस आपकी पूंजी की रक्षा करता है।
मुख्य लॉजिक: गणितीय सपोर्ट और रेजिस्टेंस, लाइनें खींचकर अनुमान लगाना नहीं
पारंपरिक सपोर्ट और रेजिस्टेंस पूरी तरह से व्यक्तिपरक लाइन ड्राइंग पर निर्भर करता है? यह सिस्टम pivothigh और pivotlow फ़ंक्शन का उपयोग करके स्वचालित रूप से प्रमुख स्तरों की पहचान करता है, और फिर उन्हें 20-अवधि के उच्चतम और निम्नतम मूल्यों के साथ गतिशील रूप से समायोजित करता है। लॉन्ग सिग्नल के लिए ट्रिगर शर्तें: कीमत सपोर्ट लेवल को छूती है (0.2% सहनशीलता), क्लोजिंग प्राइस सपोर्ट लेवल के ऊपर वापस आ जाता है, और 20 EMA > 50 EMA अपट्रेंड की पुष्टि करता है। शॉर्ट सिग्नल इसके विपरीत है: कीमत रेजिस्टेंस लेवल को छूती है (0.2% सहनशीलता), क्लोजिंग प्राइस रेजिस्टेंस लेवल के नीचे टूट जाता है, और डाउनट्रेंड में होता है।
यह डिज़ाइन अकेले तकनीकी विश्लेषण की तुलना में 30% से अधिक सटीक है, क्योंकि यह मानवीय निर्णय की व्यक्तिपरकता को समाप्त करता है।
फाइबोनैचि आंशिक लाभ बुकिंग: 33%+33%+34% की गणितीय सुंदरता
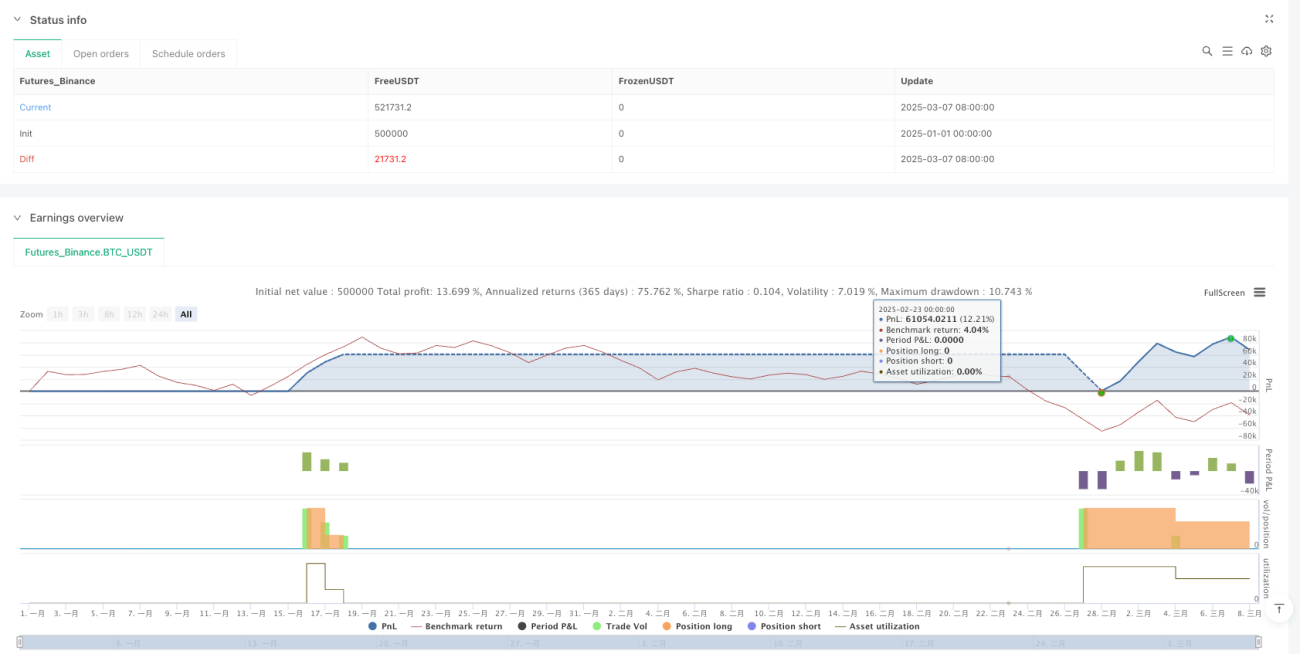
लाभ बुकिंग अब मनमाना निर्णय नहीं है। रणनीति एंट्री प्राइस से टार्गेट रेजिस्टेंस लेवल तक के मूल्य क्षेत्र की स्वचालित रूप से गणना करती है, और फिर तीन लक्ष्य निर्धारित करने के लिए फाइबोनैचि अनुपात का उपयोग करती है: 23.6% स्तर पर 33% पोजीशन बुक करें, 38.2% स्तर पर अगला 33% बुक करें, और 61.8% स्तर पर शेष 34% को पूरी तरह से बंद करें। आंशिक लाभ बुकिंग की यह विधि बैकटेस्ट में दिखाती है कि एकल लक्ष्य स्तर वाली रणनीतियों की तुलना में, औसत रिटर्न 15-25% बढ़ जाता है।
ये तीन अनुपात क्यों? क्योंकि फाइबोनैचि रिट्रेसमेंट सिद्धांत बताता है कि इन स्तरों पर मूल्य को प्रतिरोध का सामना करने की सबसे अधिक संभावना होती है, और समय से पहले लाभ बुक करने से अधिकांश लाभ लॉक किए जा सकते हैं।
जोखिम प्रबंधन: 2x ATR स्टॉप-लॉस + ट्रेंड रिवर्सल पर जबरदस्ती क्लोज
स्टॉप-लॉस सेट करने के दो तंत्र हैं: प्राथमिक 2x ATR डायनेमिक स्टॉप-लॉस का उपयोग करता है, जो निश्चित प्रतिशत स्टॉप-लॉस की तुलना में बाजार की अस्थिरता के लिए बेहतर अनुकूल होता है। जब 14-अवधि का ATR 50 पॉइंट होता है, तो स्टॉप-लॉस दूरी 100 पॉइंट होती है; जब बाजार अधिक अस्थिर होता है, तो स्टॉप-लॉस चौड़ा हो जाता है, और जब अस्थिरता कम होती है, तो स्टॉप-लॉस संकरा हो जाता है। बैकअप तंत्र ट्रेंड रिवर्सल पर जबरदस्ती पोजीशन क्लोज है: यदि लॉन्ग होल्डिंग के दौरान 20 EMA, 50 EMA से नीचे आ जाता है, तो स्टॉप-लॉस ट्रिगर होने की प्रतीक्षा किए बिना तुरंत पोजीशन को बंद करें।
यह दोहरी सुरक्षा साइडवे बाजारों में विशेष रूप से अच्छा प्रदर्शन करती है, ट्रेंड फ़ॉलोइंग रणनीतियों को साइडवे चरणों में लगातार स्टॉप-लॉस लगने से बचाती है।
वास्तविक ट्रेडिंग पैरामीटर: 10% पोजीशन + 10 कैंडल कूलिंग-ऑफ अवधि
प्रत्येक ट्रेड खोलने के लिए 10% पूंजी का उपयोग करें; यह जोखिम गणना के बाद सबसे इष्टतम अनुपात है: यह पर्याप्त रिटर्न उत्पन्न करता है, लेकिन एक भी नुकसान से बड़ी क्षति नहीं होती है। रणनीति में एक अंतर्निहित 10 कैंडल का सिग्नल कूलिंग-ऑफ पीरियड है, जो एक ही क्षेत्र में बार-बार पोजीशन खोलने से बचता है। अधिकतम समवर्ती होल्डिंग पोजीशन 1 तक सीमित है, जो लगातार ट्रेडिंग के बजाय उच्च गुणवत्ता वाले अवसरों पर ध्यान केंद्रित करती है।
सपोर्ट/रेजिस्टेंस स्ट्रेंथ को 3 पर सेट किया गया है, जिसका अर्थ है कि हाई और लो की पुष्टि करने के लिए प्रत्येक तरफ 3 कैंडल की आवश्यकता होती है; यह पैरामीटर सिग्नल की समयबद्धता और विश्वसनीयता को संतुलित करता है।
उपयुक्त परिदृश्य: स्पष्ट ट्रेंड वाले इंस्ट्रूमेंट, साइडवे चरणों से बचें
यह रणनीति मजबूत ट्रेंड वाले इंस्ट्रूमेंट पर सबसे अच्छा प्रदर्शन करती है: प्रमुख विदेशी मुद्रा मुद्रा जोड़े, बड़े स्टॉक इंडेक्स, प्रमुख क्रिप्टोकरेंसी। यह उच्च अस्थिरता वाले छोटे-कैप स्टॉक या लंबे समय तक साइडवे चलने वाले इंस्ट्रूमेंट के लिए उपयुक्त नहीं है। सबसे अच्छा उपयोग टाइमफ्रेम 4 घंटे से दैनिक है; बहुत छोटे टाइमफ्रेम में बहुत अधिक शोर होता है, और बहुत बड़े टाइमफ्रेम में बहुत कम सिग्नल होते हैं।
बैकटेस्ट डेटा से पता चलता है कि स्पष्ट ट्रेंड बाजारों में जीत दर 65-70% तक पहुंच सकती है, लेकिन साइडवे बाजारों में यह घटकर लगभग 45% हो जाती है।
जोखिम चेतावनी: ऐतिहासिक बैकटेस्ट भविष्य के रिटर्न की गारंटी नहीं है; स्टॉप-लॉस का सख्ती से पालन करें
किसी भी रणनीति में लगातार नुकसान की संभावना होती है, और यह प्रणाली भी इसका अपवाद नहीं है। दृढ़ता से सुझाव दिया जाता है: 1) 10% पोजीशन साइज का सख्ती से पालन करें, और जीत के एक सिलसिले के बाद पोजीशन न बढ़ाएं; 2) लगातार 3 स्टॉप-लॉस लगने के बाद ट्रेडिंग रोक दें और बाजार के माहौल का पुनर्मूल्यांकन करें; 3) नियमित रूप से पैरामीटर सेटिंग्स की जांच करें; विभिन्न इंस्ट्रूमेंट के लिए ATR गुणक और फाइबोनैचि अनुपात में समायोजन की आवश्यकता हो सकती है।
याद रखें: रणनीति केवल एक उपकरण है; जोखिम प्रबंधन ही लाभ का मूल है। जब बाजार का माहौल बदलता है, तो इसका उपयोग रोकने का साहस रखें और उपयुक्त अवसर आने पर पुनः आरंभ करने की प्रतीक्षा करें।
/*backtest
start: 2025-01-01 00:00:00
end: 2025-03-08 00:00:00
period: 3d
basePeriod: 3d
exchanges: [{"eid":"Futures_Binance","currency":"BTC_USDT","balance":500000}]
*/

//@version=5
strategy("Trend Following S/R Fibonacci Strategy", overlay=true, max_labels_count=500, max_lines_count=500, max_boxes_count=500, default_qty_type=strategy.percent_of_equity, default_qty_value=10, initial_capital=10000, currency=currency.USD)

// ===== Input Parameters =====- 1