
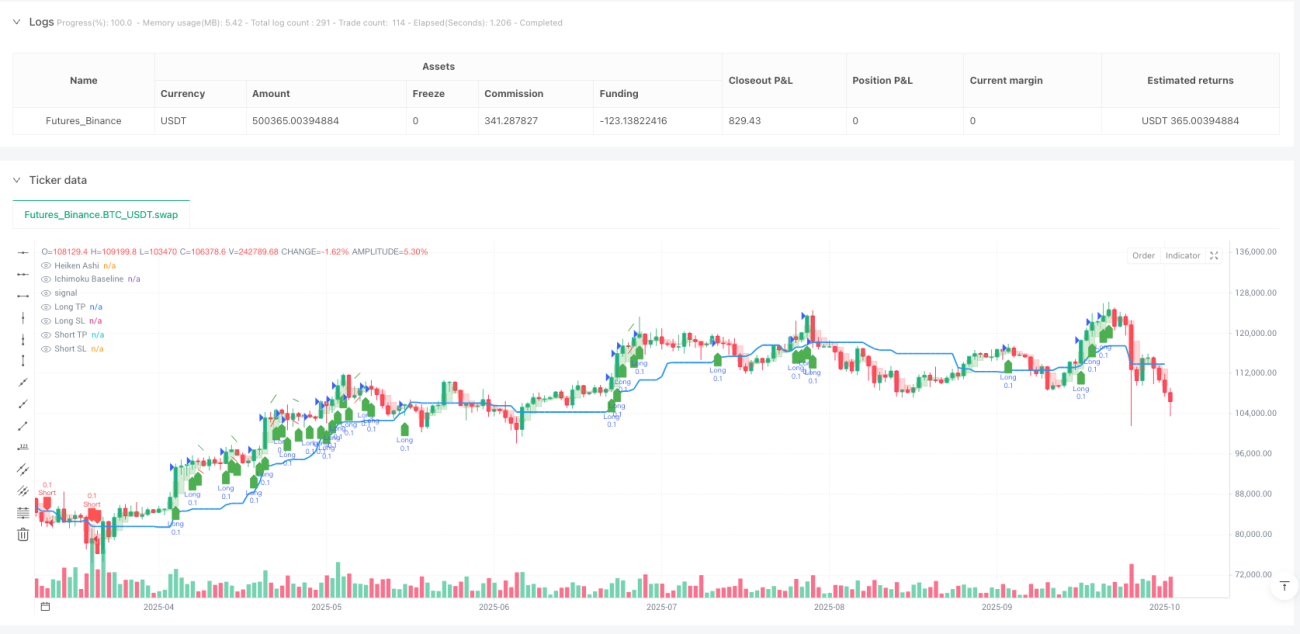
क्या आप जानते हैं? यह रणनीति एक बेंचमार्क पर एक बेंचमार्क को नृत्य करने के लिए है! यह एक साधारण K-रेखा को एक चिकनी Heiken Ashi बेंचमार्क में बदल देता है, और फिर Ichimoku क्लाउड चार्ट के साथ एक बेंचमार्क के रूप में काम करता है, जो तकनीकी विश्लेषकों के लिए “दो लोगों के लिए स्लाइडिंग स्लाइडिंग” है।
इस रणनीति का सार “ट्रिपल फ़िल्टर सिस्टम” है, और यह उतना ही सख्त है जितना कि आप दिल की जांच के लिए चुनते हैं! सबसे पहले, हेकेन आशिकु को इचिमोकू के आधार रेखा के सही पक्ष पर होना चाहिए (यह मूलभूत सीमा है); दूसरा, 200 चक्र ईएमए सुनिश्चित करता है कि आप बड़े रुझान के साथ चलते हैं (प्रवाह के खिलाफ मत जाओ); और अंत में, इचिमोकू फ़िल्टर से पीछे है ताकि यह सुनिश्चित किया जा सके कि गतिशीलता सही दिशा में है (झूठे दरार को रोकने के लिए) ।
यह ड्राइविंग की तरह हैः हरी बत्ती है ((हा सिग्नल), सड़क की स्थिति अच्छी है ((प्रवृत्ति फ़िल्टर), और कोई भी वाहन पीछे की ओर नहीं जा रहा है ((बदलाव की पुष्टि)) । तीनों स्थितियां एक साथ पूरी हो जाती हैं और ट्रेडिंग सिग्नल जारी किया जाता है!
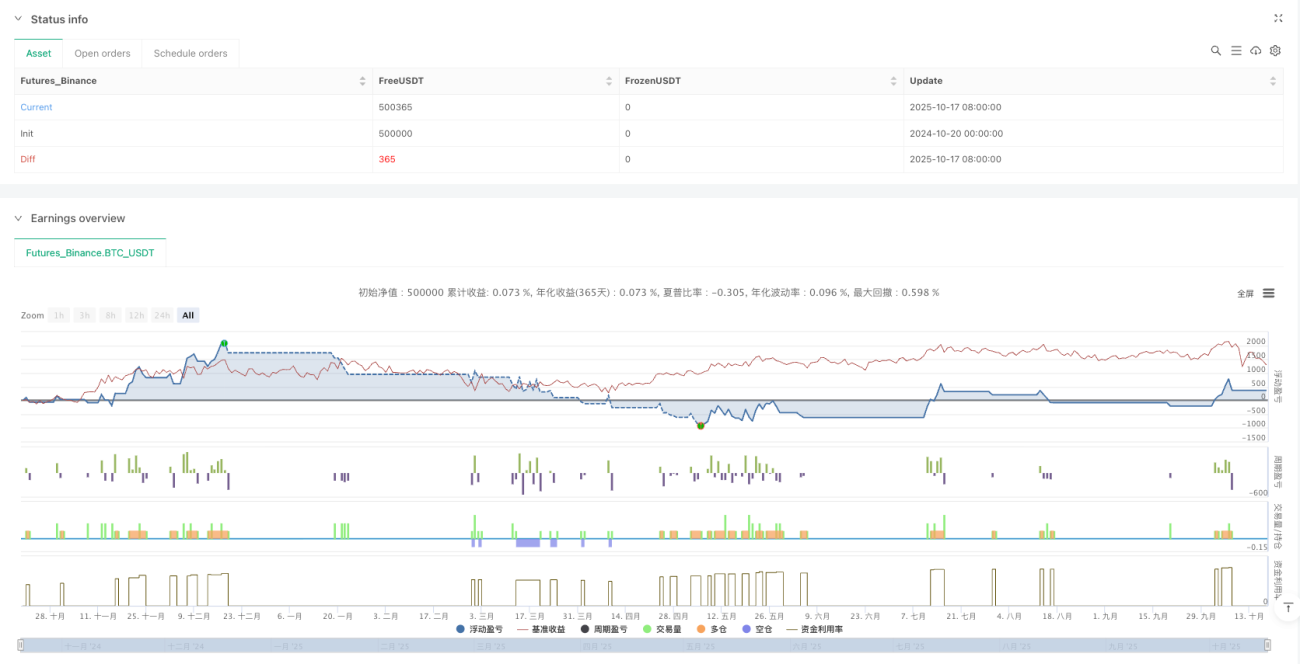
इस रणनीति के बारे में सबसे स्मार्ट बात यह है कि एटीआर का उपयोग करके स्टॉप लॉस सेट किया जाए। यह ऑटोमैटिक रूप से बाजार की अस्थिरता के लिए समायोजित होता है, जैसे कि एक कार का अनुकूली क्रूज सिस्टम। जब बाजार में उतार-चढ़ाव होता है, तो स्टॉप लॉस स्वचालित रूप से चौड़ा हो जाता है; जब यह छोटा होता है, तो स्टॉप लॉस कस जाता है।
और इससे भी बदतर, यह कई समय-सीमाओं का उपयोग करता है: उच्च समय-सीमा ATR को रोकना है (लाभ को पूरी तरह से चलाने के लिए) और कम समय-सीमा ATR को रोकना है (निष्क्रियता को रोकने के लिए) । यह वास्तव में बहुत ही अनुकूल है!
यह रणनीति विशेष रूप से स्पष्ट रूप से प्रवृत्ति वाले बाजार की स्थिति के लिए उपयुक्त है। जब बाज़ार क्षैतिज रूप से झूलता है, तो यह सलाह दी जाती है कि आप कुछ समय के लिए प्रतीक्षा करें, क्योंकि हेकेन आशिकी एक अस्थिर बाजार में झूठे संकेतों को उत्पन्न करने के लिए आसान है। सबसे अच्छा उपयोग परिदृश्यः प्रमुख मुद्रा जोड़े के लिए 4 घंटे या चक्र चार्ट, विशेष रूप से महत्वपूर्ण आर्थिक आंकड़ों के बाद प्रवृत्ति की पुष्टि के चरण में।
याद रखें, कोई भी रणनीति सर्वव्यापी नहीं है! इस रणनीति की ताकत मध्यम और दीर्घकालिक रुझानों को पकड़ने में है, और यदि आप एक त्वरित और तेज़-बाहर शॉर्ट-लाइन व्यापारी हैं, तो आपको पैरामीटर को समायोजित करने या अन्य रणनीतियों की तलाश करने की आवश्यकता हो सकती है।
/*backtest
start: 2024-10-20 00:00:00
end: 2025-10-18 08:00:00
period: 1d
basePeriod: 1d
exchanges: [{"eid":"Futures_Binance","currency":"BTC_USDT","balance":500000}]
*/
// This Pine Script® code is subject to the terms of the Mozilla Public License 2.0 at https://mozilla.org/MPL/2.0/
// © MahdiSalari8
//@version=6
strategy("Heiken Ashi Bas", overlay=true,
default_qty_type=strategy.fixed,
default_qty_value=0.1,
commission_type=strategy.commission.percent,
commission_value=0.07,
initial_capital=10000000,
pyramiding=0) // Changed to 0
// Inputs
useTrendFilter = input.bool(true, "Use 200 EMA Trend Filter", group="Filters")
showSignals = input.bool(true, "Show Buy/Sell Signals", group="Visuals")
showEma = input.bool(false, "Show 200 EMA", group="Visuals")
atrPeriod = input.int(14, "ATR Period", minval=1, group="Risk Management")
htf = input.timeframe("5", "Higher Timeframe for TP", group="Timeframes")
ltf = input.timeframe("1", "Lower Timeframe for SL", group="Timeframes")
tpMultiplier = input.float(2.0, "TP Multiplier", minval=0.1, group="Risk Management")
slMultiplier = input.float(1.0, "SL Multiplier", minval=0.1, group="Risk Management")
// Ichimoku Divergence Settings
useDivergenceFilter = input.bool(true, "Use Ichimoku Divergence Filter", group="Ichimoku Divergence")
showDivergenceLine = input.bool(true, "Show Divergence Line", group="Ichimoku Divergence")
divergenceLookback = input.int(2, "Divergence Lookback (bars)", minval=1, maxval=20, group="Ichimoku Divergence")
divergenceLineWidth = input.int(5, "Divergence Line Width", minval=1, maxval=5, group="Ichimoku Divergence")
// Heiken Ashi Calculation
var float haOpen = na
var float haClose = na
var float haHigh = na
var float haLow = na
haClose := (open + high + low + close) / 4
haOpen := na(haOpen[1]) ? (open + close) / 2 : (haOpen[1] + haClose[1]) / 2
haHigh := math.max(high, math.max(haOpen, haClose))
haLow := math.min(low, math.min(haOpen, haClose))
// Ichimoku Baseline (Kijun-sen)
kijunPeriod = 26
kijunSen = (ta.highest(high, kijunPeriod) + ta.lowest(low, kijunPeriod)) / 2
// Ichimoku Baseline Divergence Calculation
currentBaseline = kijunSen
pastBaseline = kijunSen[divergenceLookback]
// Calculate slope (divergence)
baselineSlope = (currentBaseline - pastBaseline) / divergenceLookback
// Determine bullish/bearish divergence (exclude when slope is 0)
bullishDivergence = baselineSlope > 0
bearishDivergence = baselineSlope < 0
slopeIsZero = baselineSlope == 0
// Trend Filter (200 EMA)
ema200 = ta.ema(close, 200)
// ATR Calculation for different timeframes
htfAtr = request.security(syminfo.tickerid, htf, ta.atr(atrPeriod))
ltfAtr = request.security(syminfo.tickerid, ltf, ta.atr(atrPeriod))
// Enhanced Entry Conditions with Divergence Filter (exclude when slope is 0)
longCondition = haClose > kijunSen and
haClose[1] >= kijunSen[1] and
haClose > haOpen and
(haHigh - haClose) >= (haClose - haOpen) * 0.3 and
(not useTrendFilter or close > ema200) and
(not useDivergenceFilter or (bullishDivergence and not slopeIsZero))
shortCondition = haClose < kijunSen and
haClose[1] <= kijunSen[1] and
haClose < haOpen and
(haClose - haLow) >= (haOpen - haClose) * 0.3 and
(not useTrendFilter or close < ema200) and
(not useDivergenceFilter or (bearishDivergence and not slopeIsZero))
// Dynamic TP/SL based on ATR
longTp = close + (htfAtr * tpMultiplier)
longSl = close - (ltfAtr * slMultiplier)
shortTp = close - (htfAtr * tpMultiplier)
shortSl = close + (ltfAtr * slMultiplier)
// Strategy Execution
if (longCondition)
strategy.entry("Long", strategy.long)
strategy.exit("Long Exit", "Long", limit=longTp, stop=longSl)
if (shortCondition)
strategy.entry("Short", strategy.short)
strategy.exit("Short Exit", "Short", limit=shortTp, stop=shortSl)
// Plotting
plot(kijunSen, color=color.blue, title="Ichimoku Baseline", linewidth=2, display=display.all)
// Plot Divergence Line (gray when slope is 0)
plot(showEma ? ema200 : na, color=color.purple, title="200 EMA", linewidth=1, display=display.all)
// Heiken Ashi Candles with 25% opacity
candleColor = haClose > haOpen ? color.new(color.green, 75) : color.new(color.red, 75)
plotcandle(haOpen, haHigh, haLow, haClose, title="Heiken Ashi", color=candleColor, wickcolor=candleColor, bordercolor=candleColor, display=display.all)
// Plot Buy/Sell Signals with labelup/labeldown shapes
plotshape(showSignals and longCondition, style=shape.labelup, location=location.belowbar, color=color.new(color.green, 0), size=size.small, title="Buy Signal", display=display.all)
plotshape(showSignals and shortCondition, style=shape.labeldown, location=location.abovebar, color=color.new(color.red, 0), size=size.small, title="Sell Signal", display=display.all)
// Plot TP/SL levels - TP as lines with breaks, SL hidden by default
plot(strategy.position_size > 0 ? longTp : na, "Long TP", color=color.green, style=plot.style_linebr, linewidth=1, display=display.all)
plot(strategy.position_size > 0 ? longSl : na, "Long SL", color=color.red, style=plot.style_linebr, linewidth=1, display=display.none)
plot(strategy.position_size < 0 ? shortTp : na, "Short TP", color=color.green, style=plot.style_linebr, linewidth=1, display=display.all)
plot(strategy.position_size < 0 ? shortSl : na, "Short SL", color=color.red, style=plot.style_linebr, linewidth=1, display=display.none)
// Alerts
alertcondition(longCondition, "Long Signal", "HA Cross Above Kijun-sen with Bullish Divergence")
alertcondition(shortCondition, "Short Signal", "HA Cross Below Kijun-sen with Bearish Divergence")