Pengujian ulang strategi daya panjang dan pendek

Ringkasan
Strategi kekuatan multi-lapisan dikembangkan oleh Dr. Alexander Elder, yang mengukur tekanan beli dan jual di pasar melalui indikator Elder-ray. Indikator Elder-ray biasanya digunakan bersama dengan sistem perdagangan tiga layar, tetapi juga dapat digunakan secara terpisah.
Dr. Alexander Elder menggunakan 13 hari indeks moving average (EMA) untuk menunjukkan konsensus nilai pasar. Kekuatan multipolar mencerminkan kemampuan pembeli untuk menekan harga di atas konsensus nilai. Kekuatan udara mencerminkan kemampuan penjual untuk menekan harga di bawah konsensus nilai rata-rata.
Kekuatan multihead dikurangi 13 hari EMA dengan titik tinggi. Kekuatan udara dikurangi 13 hari EMA dengan titik rendah.
Prinsip Strategi
Strategi ini digunakan untuk menilai kondisi pasar dengan menghitung indikator kekuatan udara.
- Menghitung EMA hari ke-13 sebagai konsensus nilai pasar
- Perhitungan kekuatan multipel: harga tertinggi hari dikurangi EMA 13
- Perhitungan kekuatan kosong: harga minimum hari dikurangi EMA 13
- Perbandingan antara kekuatan multihead dan kekuatan kosong dengan nilai terendah, untuk menilai apakah sinyal banyak kosong
- Anda bisa memilih untuk melakukan trading terbalik.
Bila kekuatan multihead lebih besar dari nilai threshold, sinyal multi dilakukan, dan bila kekuatan kosong lebih besar dari nilai threshold, sinyal kosong dilakukan. Selain itu, ada pilihan untuk melakukan perdagangan terbalik.
Analisis Keunggulan
- Menggunakan Indikator Kekuatan Bebas Angin untuk Menentukan Kondisi Bebas Angin di Pasar, Mudah Dimengerti
- Konfigurasi parameter yang fleksibel, threshold dan periodik yang dapat disesuaikan
- Opsi trading mundur untuk menyesuaikan diri dengan kondisi pasar yang berbeda
- Dengan menggunakan rata-rata bergerak indeks, sensitivitas terhadap kejadian yang tidak terduga lebih rendah
Analisis risiko
- Indikator kekuatan multi-udara mudah menghasilkan sinyal yang salah dan perlu disaring dalam kombinasi dengan tren dan indikator lainnya
- Siklus tetap tidak dapat beradaptasi dengan perubahan pasar, dapat menggunakan optimasi siklus adaptif
- Tidak ada stop loss, mudah diikuti oleh pasar yang mengalami kerugian besar
- Hanya menilai banyak ruang kosong, kurangnya pilihan waktu masuk ke pasar
Anda dapat mengatur stop loss, mengoptimalkan siklus rata-rata bergerak, mengoptimalkan kombinasi indikator tren, dll.
Arah optimasi
- Mengoptimalkan parameter siklus moving average, menggunakan siklus adaptasi EMA
- Menambahkan filter indikator tren untuk menghindari perdagangan berlawanan
- Meningkatkan strategi stop loss dan mengendalikan kerugian tunggal
- Terpilihnya waktu yang tepat untuk masuk ke pasar
- Pengaturan parameter pengoptimalan menggunakan teknologi pembelajaran mesin
Meringkaskan
Strategi kekuatan multi-ruang melalui indikator Elder-ray untuk menilai kondisi pasar yang kosong, sederhana dan intuitif, parameter dapat dikonfigurasi. Namun, mudah menghasilkan sinyal yang salah, perlu lebih dioptimalkan untuk memasukkan penilaian tren dan stop loss.
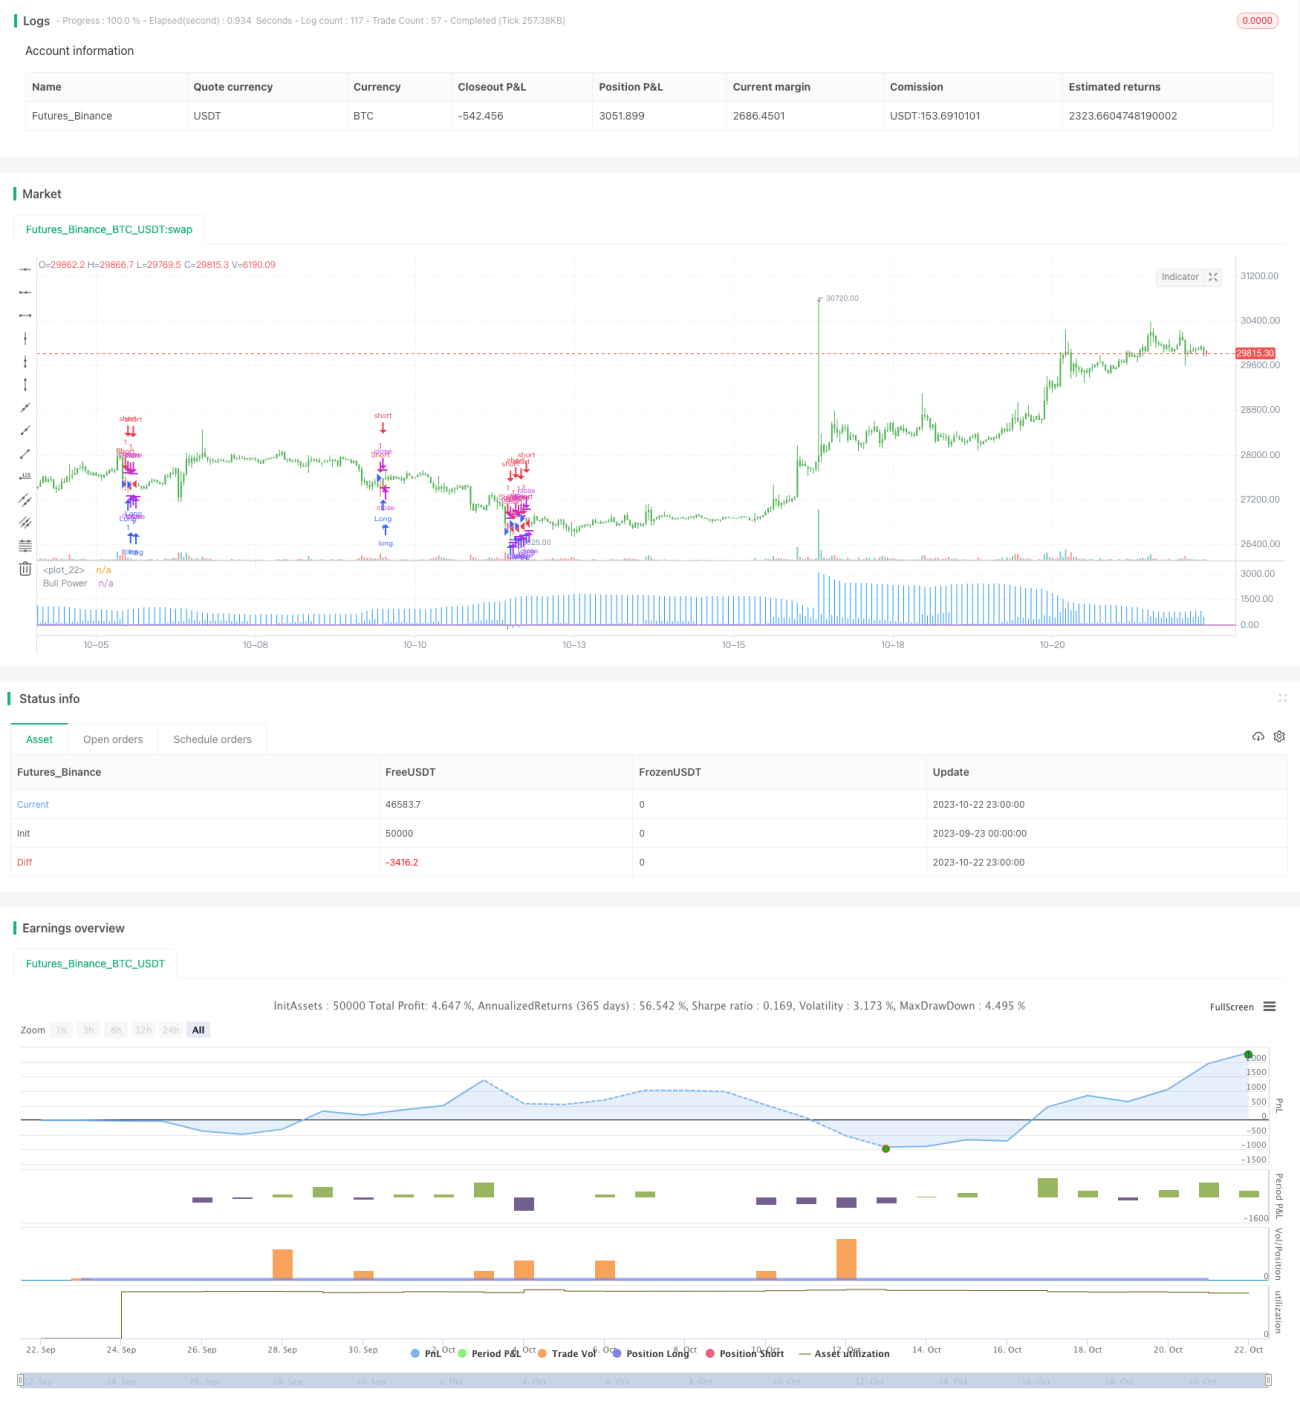
/*backtest
start: 2023-09-23 00:00:00
end: 2023-10-23 00:00:00
period: 1h
basePeriod: 15m
exchanges: [{"eid":"Futures_Binance","currency":"BTC_USDT"}]
*/

//@version = 2
////////////////////////////////////////////////////////////
//  Copyright by HPotter v1.0 08/12/2016
// Developed by Dr Alexander Elder, the Elder-ray indicator measures buying - 1