Sistem terobosan pembalikan oversold ganda

Ringkasan
Sistem double overshooting reversal breakout adalah strategi kuantitatif yang menggabungkan trend tracking dan reversal trading. Strategi ini menghasilkan sinyal beli dengan menghitung apakah ada sinyal overshooting berturut-turut pada harga penutupan N hari sebelum harga saham dibandingkan; sekaligus menghasilkan sinyal jual dengan menghitung rata-rata bergerak T3 dari parameter tertentu, untuk mencapai perlindungan keuntungan.
Prinsip Strategi
Strategi ini terdiri dari dua bagian:
- 123 sistem reversal
Menurut buku ini, sistem berbalik ini mengamati perubahan harga penutupan selama N hari terakhir, dan jika harga penutupan hari ini naik lebih tinggi dari hari sebelumnya, dan harga penutupan dua hari sebelumnya turun, maka dianggap sebagai sinyal overbought dua hari berturut-turut, sistem ini menghasilkan sinyal beli. Selain itu, sistem ini juga akan menggabungkan indikator STOCH, jika garis cepat STOCH hari ini lebih rendah dari garis lambat, untuk lebih mengkonfirmasi validitas sinyal beli.
- T3 Moving Average
Rata-rata bergerak T3 adalah rata-rata bergerak indeks yang dihitung berdasarkan rumus tertentu yang digabungkan dengan harga. Ini mengatur sensitivitas rata-rata bergerak terhadap perubahan harga melalui parameter tertentu.
Strategi ini akan menggabungkan dua bagian sinyal di atas, yang masing-masing menghasilkan sinyal perdagangan yang sebenarnya ketika sinyal beli 123 reversed dan sinyal jual T3 moving average terpenuhi secara bersamaan.
Analisis Keunggulan
- Strategi trading reverse, cocok untuk opsi buy-bottom, melacak over/under rebound
- Strategi Moving Average untuk Mengunci Keuntungan dan Menghindari Risiko
- Kombinasi sinyal ganda dapat meningkatkan efektivitas sinyal dan mengurangi sinyal palsu
- Keuntungan dari trend tracking dan reversal trading
- Parameter yang dapat disesuaikan, dapat beradaptasi dengan berbagai situasi
Analisis risiko
- Sinyal-sinyal pembalikan dapat menyebabkan kesalahan penilaian dan perdagangan yang merugikan
- Setting parameter yang tidak tepat dapat menyebabkan frekuensi transaksi, meningkatkan biaya transaksi dan biaya slippage
- Sinyal jual yang dihasilkan oleh moving averages dapat mengunci keuntungan lebih awal
- Risiko Stop Loss Masih Ada Saat Peristiwa Berubah Besar
- Parameter yang perlu dioptimalkan untuk memilih parameter terbaik untuk varietas yang berbeda
Langkah-langkah yang dapat diambil untuk mengatasi risiko adalah sebagai berikut:
- Menyesuaikan parameter reversal trading dengan tepat untuk memastikan efektivitas sinyal
- Menyesuaikan parameter rata-rata bergerak, memperpanjang jangka waktu posisi secara tepat
- Meningkatkan strategi stop loss dan mengurangi kerugian tunggal
- Optimalkan pilihan parameter, pilih parameter untuk varietas yang berbeda
Arah optimasi
Strategi ini dapat dioptimalkan dalam beberapa hal:
-
Menambahkan kondisi penyaringan untuk memastikan sinyal perdagangan efektif
Anda dapat menambahkan indikator teknis lainnya sebagai syarat penyaringan, seperti persyaratan terobosan untuk meningkatkan volume transaksi, dan lain-lain, untuk menghindari kesalahan transaksi yang disebabkan oleh kebisingan.
-
Menyesuaikan pengaturan parameter dengan kondisi pasar
Anda dapat melakukan pengembalian dengan berbagai kombinasi parameter, memilih kombinasi yang sesuai dengan tingkat pengembalian tertinggi untuk mengoptimalkan efek strategi. Anda juga dapat mengatur parameter dinamis, menyesuaikan secara real-time sesuai dengan situasi pasar.
-
Mengoptimalkan Adaptifitas Strategi dengan Menggunakan Pembelajaran Mesin
Sebagai contoh, dapat mengumpulkan banyak data historis, menggunakan model pelatihan pembelajaran mesin, untuk memprediksi waktu pembelian dan penjualan terbaik.
-
Menetapkan parameter independen berdasarkan karakteristik varietas
Berbagai varietas memiliki karakteristik yang berbeda, parameter yang sesuai juga akan berbeda. Anda dapat melakukan pengukuran terpisah berdasarkan data varietas yang berbeda, dan mengatur parameter independen.
Meringkaskan
Sistem terobosan double overbought dan overbought menggabungkan keuntungan dari pelacakan tren dan perdagangan reversal. Ini dapat membeli harga yang lebih rendah pada fase overbought dan berhenti tepat waktu setelah memanfaatkan keuntungan tren. Kombinasi efektif dari sinyal reversal dan sinyal tren ini dapat secara efektif mendapatkan peluang reversal dan mengunci keuntungan.
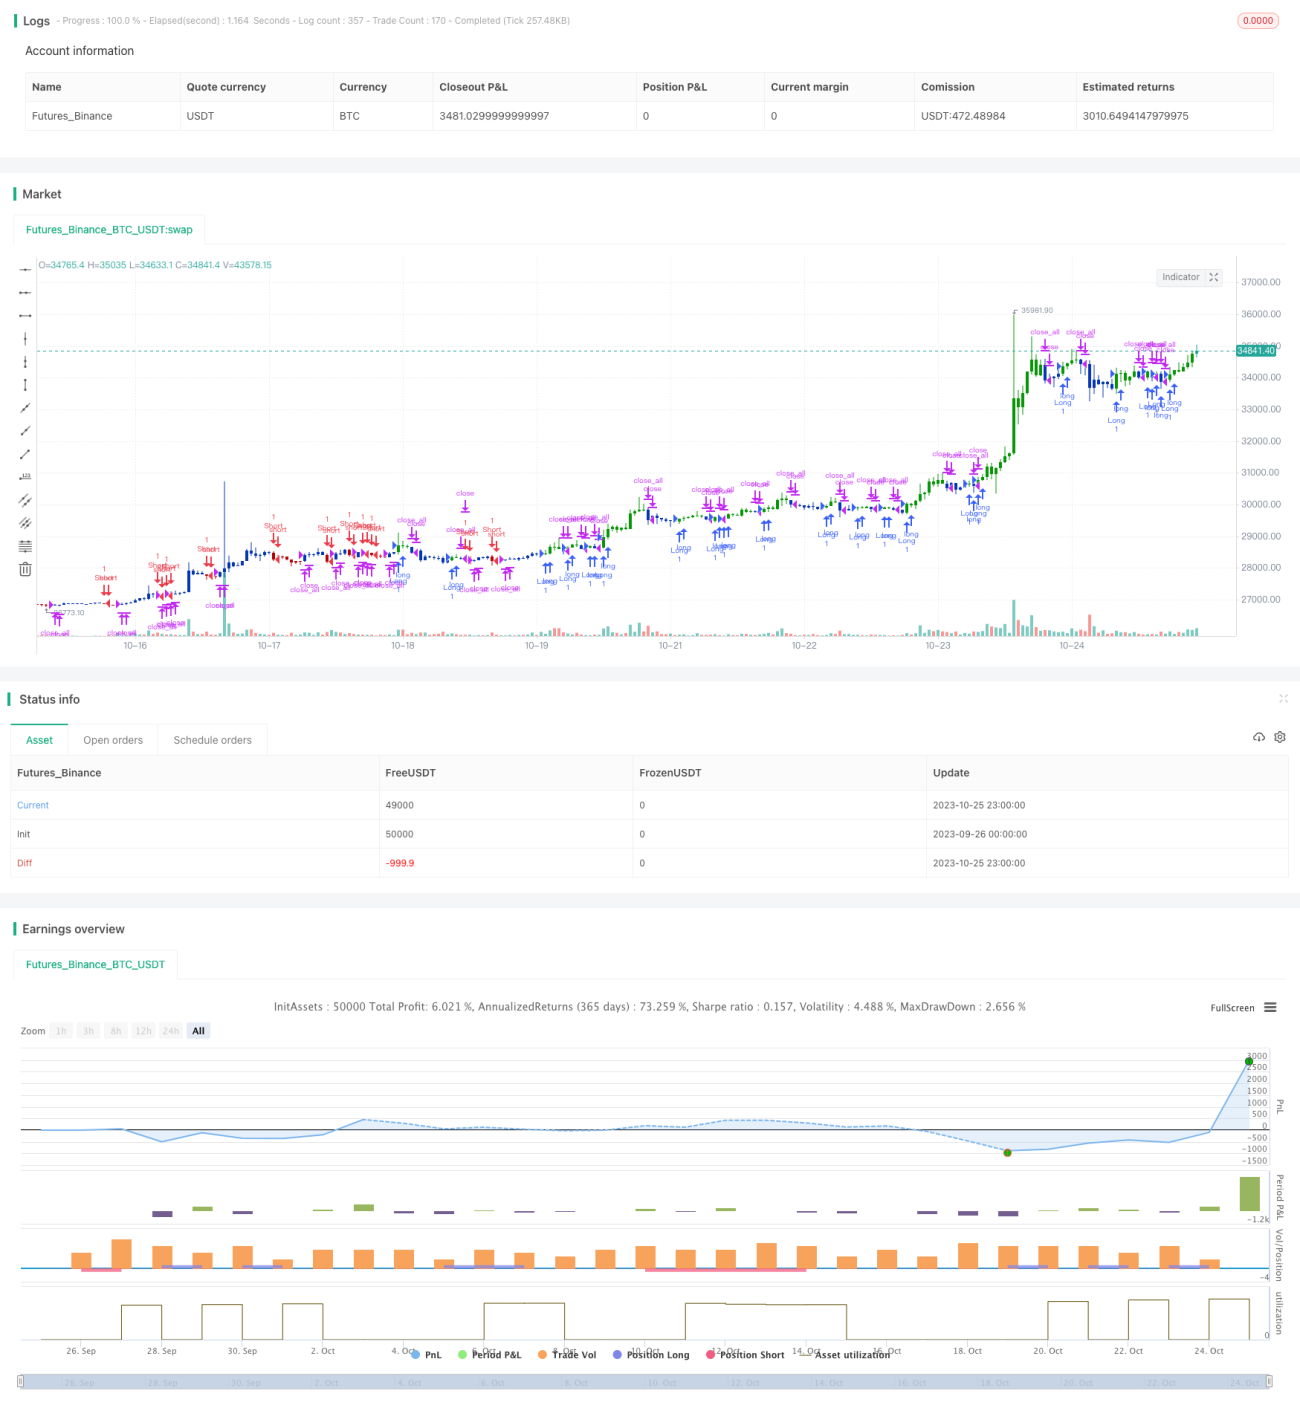
/*backtest
start: 2023-09-26 00:00:00
end: 2023-10-26 00:00:00
period: 1h
basePeriod: 15m
exchanges: [{"eid":"Futures_Binance","currency":"BTC_USDT"}]
*/

//@version=4
////////////////////////////////////////////////////////////
//  Copyright by HPotter v1.0 16/09/2021
// This is combo strategies for get a cumulative signal. - 1