Strategi bullish dan bearish mata uang kripto berdasarkan indikator Wall Street Mouse Halo


Tanggal Pembuatan: 2023-11-01 11:27:20 Akhirnya memodifikasi: 2023-11-01 11:27:20
menyalin: 0 Jumlah klik: 681
1
fokus pada
1617
Pengikut

Strategi bullish dan bearish mata uang kripto berdasarkan indikator Wall Street Mouse Halo

Ringkasan

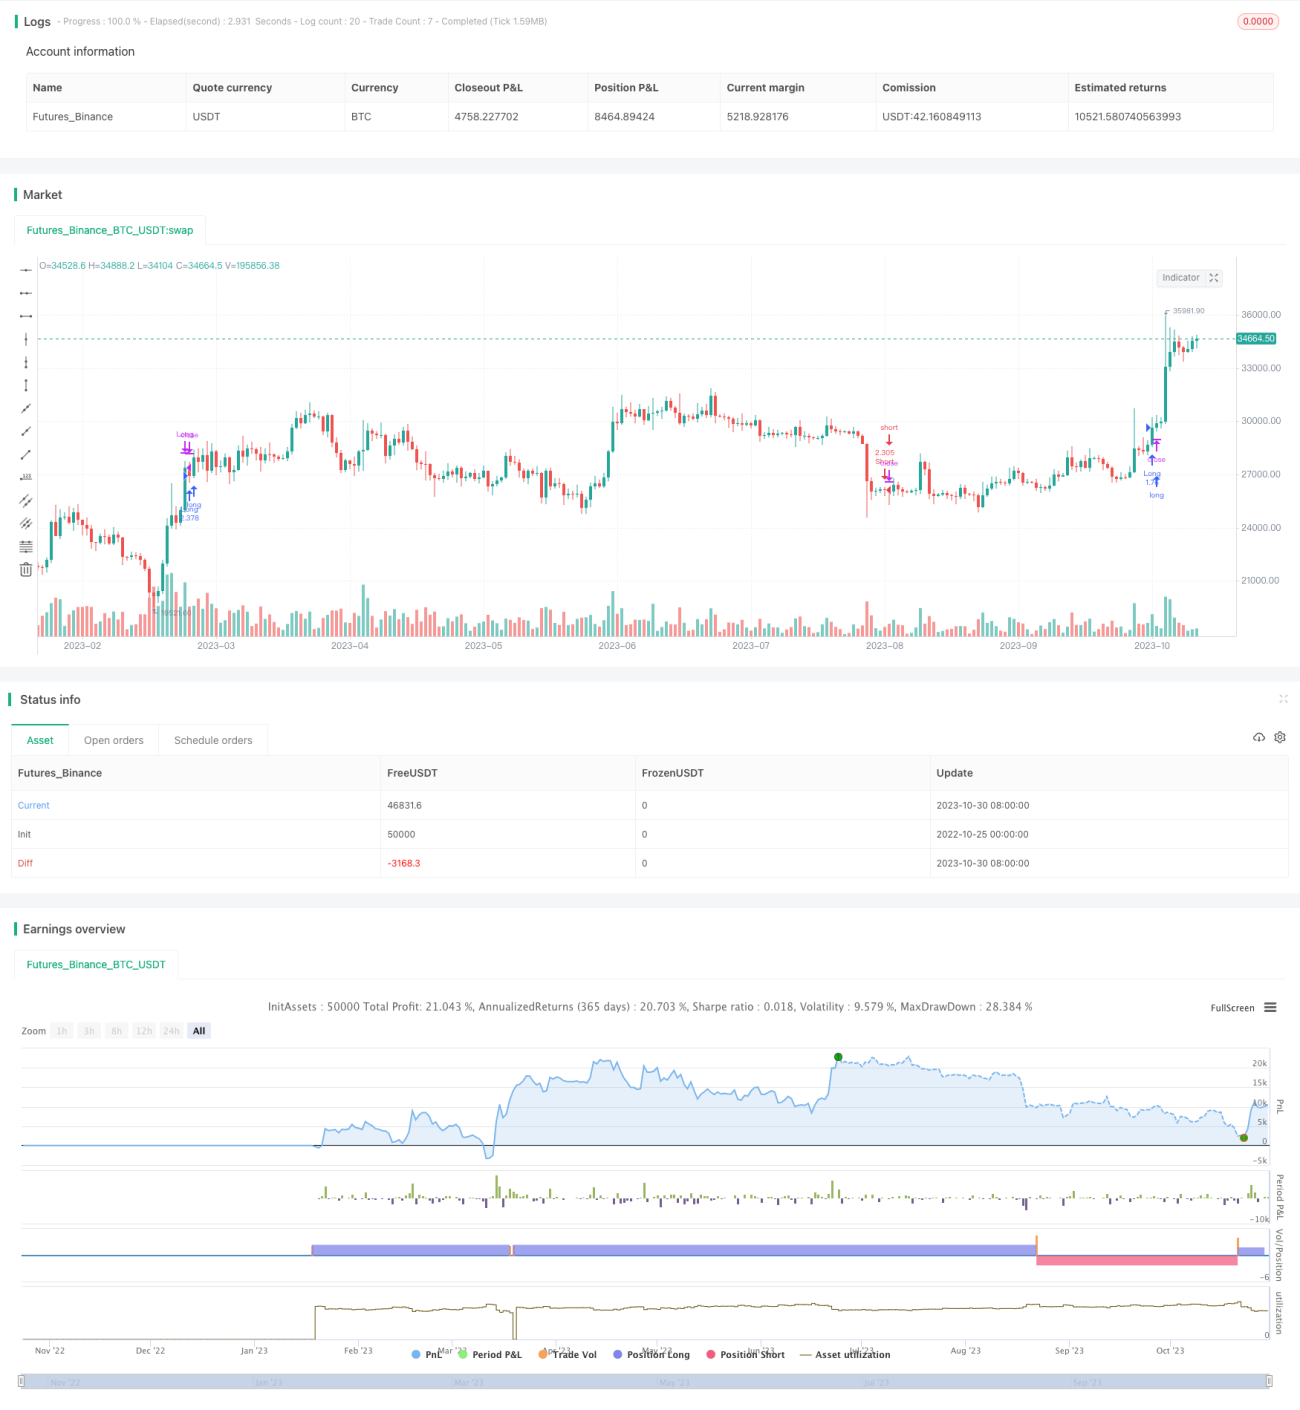
Strategi ini didasarkan pada indikator Wall Street Capture Glossary, yang membandingkan tren turun-turun di pasar cryptocurrency acuan, untuk memungkinkan strategi perdagangan otomatis untuk melakukan operasi bullish-bullish pada mata uang crypto target. Strategi ini dapat melacak perdagangan pada berbagai mata uang crypto berdasarkan parameter indikator dukungan yang disetel oleh mata uang crypto yang berbeda.

Prinsip Strategi

  1. Perhitungan garis rata-rata Wall Street Rat Trap GLOBAL INDICATOR untuk cryptocurrency acuan, dengan panjang garis rata-rata 200 siklus.

  2. Untuk menentukan posisi turunnya garis rata-rata: ketika garis rata-rata naik, strategi mengambil operasi bullish; ketika garis rata-rata turun, strategi mengambil operasi bearish.

  3. Strategi untuk melakukan posisi terbuka dan posisi terbuka secara otomatis berdasarkan kondisi garis rata-rata yang turun dan turun, dan situasi posisi saat ini:

    • Ketika rata-rata naik dan tidak ada posisi saat ini, harga pasar strategi secara otomatis mengambil posisi lebih tinggi;

    • Ketika rata-rata turun dan tidak ada posisi saat ini, harga pasar strategi secara otomatis membuka posisi short;

    • Ketika keuntungan dari posisi multi mencapai rasio stop loss yang ditetapkan, harga pasar strategi secara otomatis merata untuk melakukan multi order;

    • Ketika keuntungan dari posisi short mencapai rasio stop loss yang ditetapkan, harga pasar strategi secara otomatis melunasi opsi short;

    • Ketika kerugian dalam posisi overnight mencapai rasio stop loss yang ditetapkan, harga pasar strategi secara otomatis merata untuk overnight;

    • Ketika kerugian posisi short position mencapai stop loss yang ditetapkan, harga pasar strategi secara otomatis melunasi short position.

  4. Strategi memperbarui harga stop loss dan stop loss secara real-time sesuai dengan perubahan pasar cryptocurrency acuan.

Analisis Keunggulan

  1. Strategi ini memiliki kemampuan beradaptasi yang kuat, memungkinkan pengaturan parameter yang berbeda untuk cryptocurrency yang berbeda, dan memungkinkan untuk melacak transaksi di berbagai cryptocurrency.

  2. Menggunakan Wall Street Rat Trap Gloss Indicator untuk menilai tren pasar, dapat menghindari kesalahan perdagangan yang disebabkan oleh kebisingan. Indikator ini memiliki keterlambatan tertentu terhadap terobosan naik dan turun, dapat mengurangi kerugian yang disebabkan oleh terobosan palsu.

  3. Strategi ini menggabungkan mekanisme stop loss untuk menangkap tren untuk mengejar penurunan dan mengendalikan kerugian tunggal.

  4. Strategi untuk melakukan perdagangan otomatis tanpa intervensi manusia, beroperasi 24 jam.

Analisis risiko

  1. Ada kemungkinan bahwa beberapa harga cryptocurrency akan menyimpang dari mata uang kripto acuan, sehingga menyebabkan risiko bahwa strategi tidak dapat melakukan perdagangan yang normal. Anda dapat mengoptimalkan untuk menghitung koefisien terkait dengan menggunakan beberapa mata uang kripto acuan, memilih mata uang kripto acuan yang paling relevan.

  2. Ada risiko bahwa stop loss akan ditembus karena fluktuasi pasar yang tidak normal. Stop loss rasio dapat disesuaikan atau ditambahkan ke dalam tracking stop loss.

  3. Ada risiko bahwa setting stop loss terlalu kecil sehingga tidak dapat menangkap keuntungan tren yang cukup. Anda dapat menambahkan trend tracking atau stop loss dinamis.

  4. Ada risiko false breakout yang menyebabkan posisi terhenti. Parameter indikator dapat disesuaikan, pengaturan identifikasi dapat ditambahkan, atau mekanisme masuk kembali dapat dimasukkan.

Arah optimasi

  1. Menggunakan analisis relevansi untuk memilih beberapa mata uang kripto acuan, mengkombinasikan indikator untuk mengurangi risiko mata uang acuan tunggal.

  2. Menambahkan mekanisme pelacakan tren, menyesuaikan stop loss dan stop loss sesuai dengan dinamika fluktuasi.

  3. Tingkatkan Stop Loss untuk mencegah Extreme Stop Loss.

  4. Menambahkan mekanisme penerimaan kembali untuk menghindari kerugian yang tidak terjawab.

  5. Mengoptimalkan parameter indikator, identification setting, dan meningkatkan efek indikator.

  6. Optimalisasi parameter untuk berbagai mata uang kripto, meningkatkan adaptasi strategi.

  7. Mengoptimalkan manajemen posisi, menyesuaikan posisi secara dinamis sesuai dengan skala dana.

Meringkaskan

Strategi ini secara keseluruhan adalah strategi pelacakan tren yang khas. Ide utamanya adalah menilai arah tren mata uang kripto acuan berdasarkan indikator Wall Street Mouse Ring, untuk menentukan arah perdagangan mata uang kripto target. Strategi ini memiliki keuntungan tertentu, tetapi ada juga beberapa risiko yang perlu diperhatikan.

Kode Sumber Strategi
/*backtest
start: 2022-10-25 00:00:00
end: 2023-10-31 00:00:00
period: 1d
basePeriod: 1h
exchanges: [{"eid":"Futures_Binance","currency":"BTC_USDT"}]
*/

// This source code is subject to the terms of the Mozilla Public License 2.0 at https://mozilla.org/MPL/2.0/
// © levieux

//@version=5
strategy(title='Correlation Strategy', shorttitle='Correlation Strategy', initial_capital=1000, overlay=true, default_qty_type=strategy.percent_of_equity, default_qty_value=100, commission_type=strategy.commission.percent, commission_value=0.1)

supportLength = input.int(200, minval=1, title='Support Length')
supportSymbol = input('BTC_USDT:swap', title='Correlated Symbol')
supportSource = input(hlc3, title='Price Source')
takeprofitLong = input.float(0.2, 'Take Profit Long', step=0.01)
takeprofitShort = input.float(0.15, 'Take Profit Short', step=0.01)
stoplossLong = input.float(0.1, 'Stop Loss Long', step=0.01)
stoplossShort = input.float(0.04, 'Stop Loss Short', step=0.01)
start = input(defval = timestamp("01 Jan 2016 00:00 +0000"), title = "Start Time")
end = input(defval = timestamp("31 Dec 2050 23:59 +0000"), title = "End Time")

supportTicker = request.security(supportSymbol, timeframe.period, supportSource, lookahead=barmerge.lookahead_off)  //input(close, title="Source")
supportLine = ta.wma(supportTicker, supportLength)

window() => true

if not window()
    strategy.cancel_all()

supportLongPrice = close
supportShortPrice = close

if strategy.position_size > 0
    supportLongPrice := supportLongPrice[1]
if strategy.position_size < 0
    supportShortPrice := supportShortPrice[1]

longCondition = ta.rising(supportLine, 5) and window() and strategy.position_size <= 0
shortCondition = ta.falling(supportLine, 5) and window() and window() and strategy.position_size > 0
takeprofitLongCondition = takeprofitLong > 0 and window() and strategy.position_size > 0 and supportTicker > supportLongPrice * (1 + takeprofitLong)
stoplossLongCondition = stoplossLong > 0 and window() and strategy.position_size > 0 and supportTicker < supportLongPrice * (1 - stoplossLong)
takeprofitShortCondition = takeprofitShort > 0 and window() and strategy.position_size < 0 and supportTicker > supportShortPrice * (1 + takeprofitShort)
stoplossShortCondition = stoplossShort > 0 and window() and strategy.position_size < 0 and supportTicker < supportShortPrice * (1 - stoplossShort)

if longCondition
    strategy.entry('Long', strategy.long)
    supportLongPrice := supportTicker

if shortCondition
    strategy.entry('Short', strategy.short)
    supportShortPrice := supportTicker

if takeprofitLongCondition
    strategy.close('Long')
if stoplossLongCondition
    strategy.close('Long')
if takeprofitShortCondition
    strategy.close('Short')
if stoplossShortCondition
    strategy.close('Short')

///////////////////
// MONTHLY TABLE //

new_month = month(time) != month(time[1])
new_year  = year(time)  != year(time[1])

eq = strategy.equity

bar_pnl = eq / eq[1] - 1
bar_bh = (close-close[1])/close[1]

cur_month_pnl = 0.0
cur_year_pnl  = 0.0
cur_month_bh = 0.0
cur_year_bh  = 0.0

// Current Monthly P&L
cur_month_pnl := new_month ? 0.0 : 
                 (1 + cur_month_pnl[1]) * (1 + bar_pnl) - 1 
cur_month_bh := new_month ? 0.0 : 
                 (1 + cur_month_bh[1]) * (1 + bar_bh) - 1

// Current Yearly P&L
cur_year_pnl := new_year ? 0.0 : 
                 (1 + cur_year_pnl[1]) * (1 + bar_pnl) - 1
cur_year_bh := new_year ? 0.0 : 
                 (1 + cur_year_bh[1]) * (1 + bar_bh) - 1

// Arrays to store Yearly and Monthly P&Ls
var month_pnl  = array.new_float(0)
var month_time = array.new_int(0)
var month_bh  = array.new_float(0)

var year_pnl  = array.new_float(0)
var year_time = array.new_int(0)
var year_bh  = array.new_float(0)

end_time = false

end_time:= time_close + (time_close - time_close[1]) > timenow or barstate.islastconfirmedhistory

if (not na(cur_month_pnl[1]) and (new_month or end_time))
    if (end_time[1])
        array.pop(month_pnl)
        array.pop(month_time)
        
    array.push(month_pnl , cur_month_pnl[1])
    array.push(month_time, time[1])
    array.push(month_bh , cur_month_bh[1])

if (not na(cur_year_pnl[1]) and (new_year or end_time))
    if (end_time[1])
        array.pop(year_pnl)
        array.pop(year_time)
        
    array.push(year_pnl , cur_year_pnl[1])
    array.push(year_time, time[1])
    array.push(year_bh , cur_year_bh[1])

// Monthly P&L Table    
var monthly_table = table(na)

getCellColor(pnl, bh)  => 
    if pnl > 0
        if bh < 0 or pnl > 2 * bh
            color.new(color.green, transp = 20)
        else if pnl > bh
            color.new(color.green, transp = 50)
        else
            color.new(color.green, transp = 80)
    else
        if bh > 0 or pnl < 2 * bh
            color.new(color.red, transp = 20)
        else if pnl < bh
            color.new(color.red, transp = 50)
        else
            color.new(color.red, transp = 80)

if end_time
    monthly_table := table.new(position.bottom_right, columns = 14, rows = array.size(year_pnl) + 1, border_width = 1)

    table.cell(monthly_table, 0,  0, "",     bgcolor = #cccccc)
    table.cell(monthly_table, 1,  0, "Jan",  bgcolor = #cccccc)
    table.cell(monthly_table, 2,  0, "Feb",  bgcolor = #cccccc)
    table.cell(monthly_table, 3,  0, "Mar",  bgcolor = #cccccc)
    table.cell(monthly_table, 4,  0, "Apr",  bgcolor = #cccccc)
    table.cell(monthly_table, 5,  0, "May",  bgcolor = #cccccc)
    table.cell(monthly_table, 6,  0, "Jun",  bgcolor = #cccccc)
    table.cell(monthly_table, 7,  0, "Jul",  bgcolor = #cccccc)
    table.cell(monthly_table, 8,  0, "Aug",  bgcolor = #cccccc)
    table.cell(monthly_table, 9,  0, "Sep",  bgcolor = #cccccc)
    table.cell(monthly_table, 10, 0, "Oct",  bgcolor = #cccccc)
    table.cell(monthly_table, 11, 0, "Nov",  bgcolor = #cccccc)
    table.cell(monthly_table, 12, 0, "Dec",  bgcolor = #cccccc)
    table.cell(monthly_table, 13, 0, "Year", bgcolor = #999999)


    for yi = 0 to array.size(year_pnl) - 1
        table.cell(monthly_table, 0,  yi + 1, str.tostring(year(array.get(year_time, yi))), bgcolor = #cccccc)
        
        y_color = getCellColor(array.get(year_pnl, yi), array.get(year_bh, yi))
        table.cell(monthly_table, 13, yi + 1, str.tostring(math.round(array.get(year_pnl, yi) * 100)) + " (" + str.tostring(math.round(array.get(year_bh, yi) * 100)) + ")", bgcolor = y_color)
        
    for mi = 0 to array.size(month_time) - 1
        m_row   = year(array.get(month_time, mi))  - year(array.get(year_time, 0)) + 1
        m_col   = month(array.get(month_time, mi)) 
        m_color = getCellColor(array.get(month_pnl, mi), array.get(month_bh, mi))
        
        table.cell(monthly_table, m_col, m_row, str.tostring(math.round(array.get(month_pnl, mi) * 100)) + " (" + str.tostring(math.round(array.get(month_bh, mi) * 100)) +")", bgcolor = m_color)