Strategi perdagangan kuantitatif menggunakan beberapa indikator untuk mengidentifikasi titik pembalikan perdagangan

Ringkasan
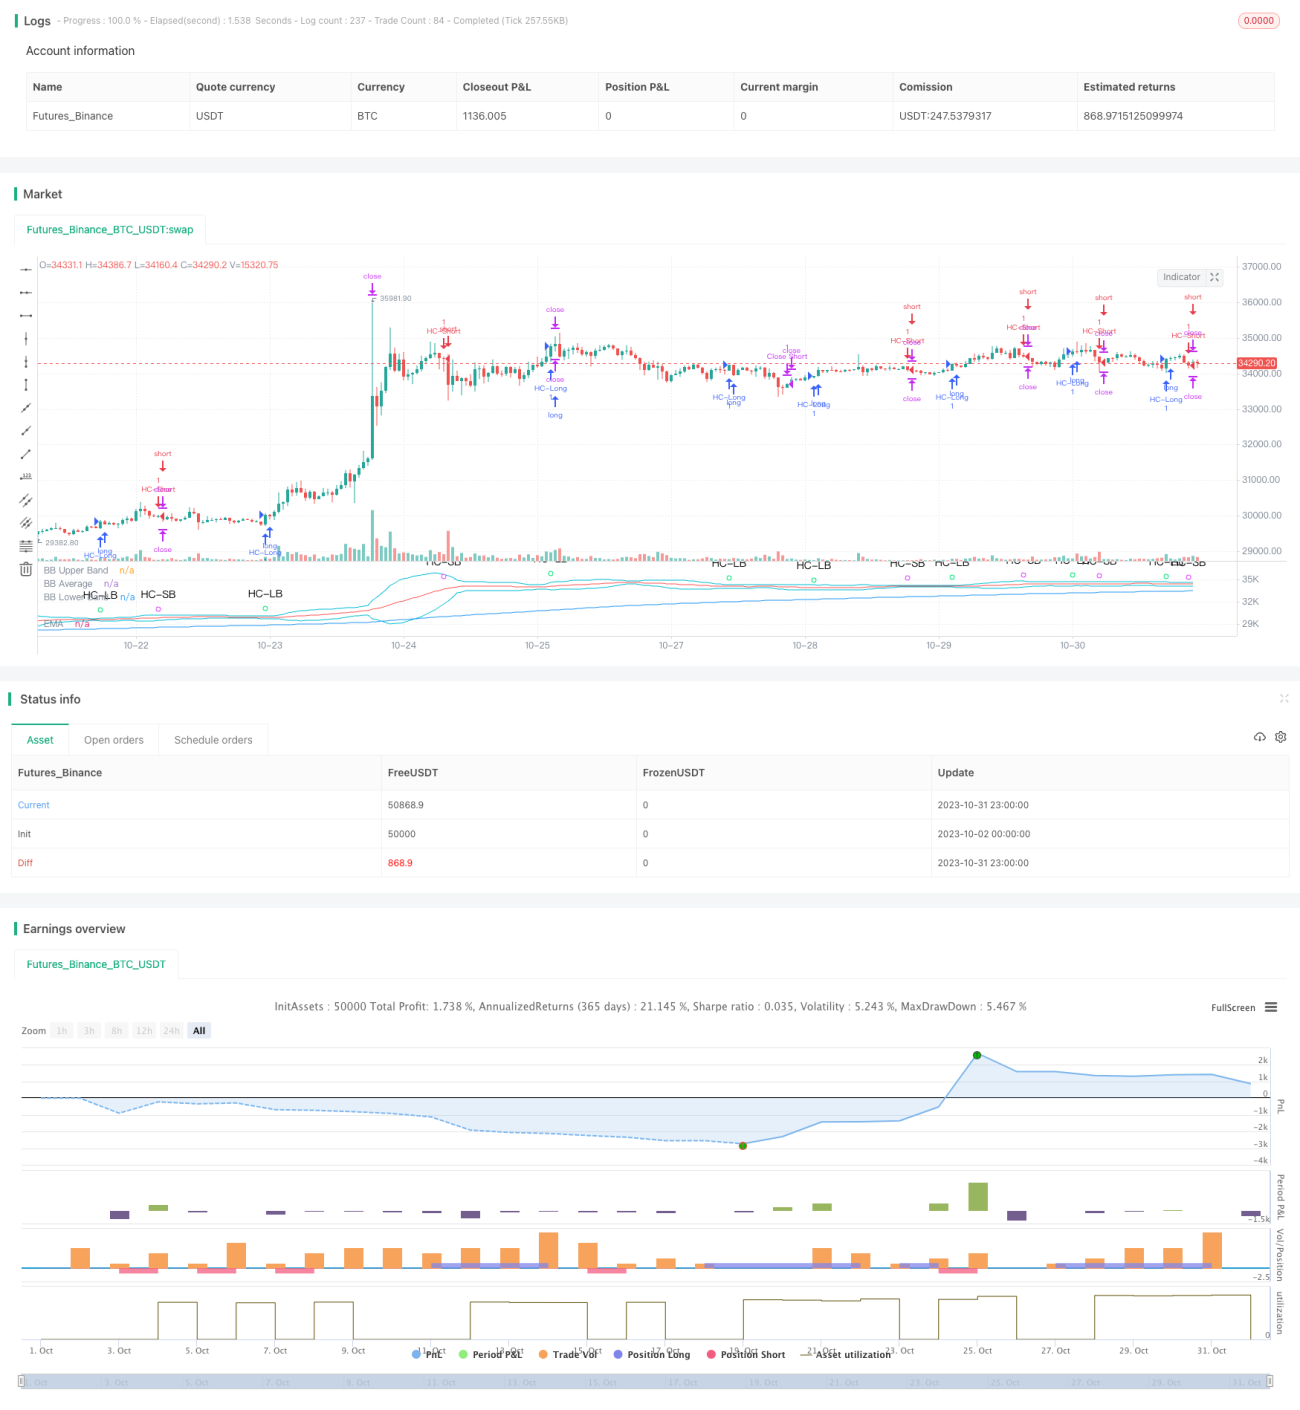
Strategi ini menggunakan lima indikator utama EMA, VWAP, MACD, Bollinger Bands dan Schaff Trend Cycle untuk mengidentifikasi titik balik harga dalam kisaran tertentu, mengirim sinyal beli dan jual. Keuntungan dari strategi ini adalah bahwa portofolio dapat disesuaikan dengan indikator pasar yang berbeda, mengurangi probabilitas sinyal palsu, meningkatkan probabilitas keuntungan.
Prinsip Strategi
-
EMA rata-rata menilai arah tren besar, hanya membeli di arah tren
-
VWAP menilai bahwa dana yang mengalir ke lembaga hanya dibeli di tempat yang dibeli oleh lembaga.
-
MACD menilai tren garis pendek dan perubahan momentum, MACD garis menerobos garis sinyal dianggap sebagai sinyal beli/jual
-
Bollinger Bands menilai apakah ada oversold atau oversold, dengan harga yang melintasi rel bawah dianggap sebagai sinyal beli/jual
-
Schaff Trend Cycle menilai struktur perombakan jangka pendek yang berputar, melampaui batas tinggi dan rendah dianggap sebagai sinyal beli / jual
-
Instruksi beli/jual muncul saat 5 indikator besar berkoordinasi
-
Menetapkan Stop Loss dan Stop Loss, Optimalkan Manajemen Dana
Keunggulan Strategis
- Kombinasi multi-indikator mengurangi probabilitas sinyal palsu
Menggunakan kombinasi dari berbagai indikator seperti EMA, VWAP, MACD, BB dan STC, dapat saling diverifikasi, mengurangi sinyal palsu yang dihasilkan oleh satu indikator tunggal, sehingga meningkatkan keandalan sinyal.
- Indikator dapat disesuaikan
Memungkinkan untuk memilih apakah akan menggunakan satu indikator atau kombinasi indikator berdasarkan varietas dan kondisi pasar yang berbeda, sehingga strategi lebih tertarget dan adaptif.
- Pengelolaan dana yang optimal
Tetapkan stop loss dan stop loss untuk membatasi kerugian tunggal dan mengunci sebagian dari keuntungan untuk pengelolaan dana yang lebih baik.
- Strategi yang jelas
Dengan menggunakan indikator yang sederhana dan intuitif, dan dilengkapi dengan komentar kode yang terperinci, seluruh strategi menjadi jelas dan mudah dipahami dan dimodifikasi.
- Bermanfaat
Berbagai indikator yang digunakan secara luas, parameter yang diatur secara wajar, dapat langsung digunakan untuk perdagangan langsung, tidak perlu banyak pengoptimalan untuk mencapai efek yang baik.
Risiko Strategis
- Risiko terlambat mengidentifikasi perubahan indikator
Indikator seperti EMA, MACD dan lain-lain memiliki keterlambatan dalam mengidentifikasi perubahan harga, dan mungkin melewatkan saat terbaik untuk membeli.
- Risiko pengaturan parameter yang salah
Jika parameter indikator tidak diatur dengan benar, akan menghasilkan banyak sinyal palsu dan tidak dapat menjalankan strategi dengan baik.
- Risiko yang tidak terjamin
Kombinasi multi-indikator dapat meningkatkan tingkat kemenangan, tetapi tidak dapat memastikan bahwa setiap perdagangan menguntungkan. Perubahan lingkungan pasar dapat menyebabkan penurunan tingkat kemenangan.
- Stop Loss Menetapkan Risiko Terlalu Kecil
Jika stop loss terlalu kecil, maka stop loss dapat dilakukan pada saat harga normal berfluktuasi, menambah kerugian yang tidak perlu.
Arah optimasi strategi
- Menambahkan model pembelajaran mesin untuk menilai keandalan sinyal
Model dapat dilatih untuk menilai keandalan sinyal multi-indikator, memberi nilai pada sinyal, dan mengurangi sinyal palsu.
- Meningkatkan Indikator Kuantitatif untuk Identifikasi Tren
Menambahkan beberapa indikator kuantitatif seperti OBV, untuk mengidentifikasi tanda-tanda kenaikan harga, dan meningkatkan kepastian pembelian.
- Optimalkan strategi stop loss
Anda dapat mempelajari strategi stop loss atau lock-in yang lebih cocok untuk strategi ini, dan mengoptimalkan pengelolaan uang Anda.
- Optimasi parameter
Optimalkan parameter masing-masing indikator dengan pengulangan yang lebih sistematis untuk meningkatkan stabilitas keseluruhan strategi.
- Meningkatkan perdagangan robot
Menghubungkan API transaksi, melakukan pemesanan otomatis, sehingga strategi dapat benar-benar berjalan tanpa pengawasan manusia.
Meringkaskan
Strategi ini mengintegrasikan keunggulan berbagai indikator teknis, ide yang jelas, praktis, dan dapat digunakan sebagai referensi keputusan untuk perdagangan diskretionary, atau dapat digunakan langsung untuk perdagangan algoritmik. Namun, tetap perlu melakukan penyesuaian yang optimal untuk varietas dan lingkungan pasar tertentu, mengurangi risiko dan meningkatkan stabilitas, dan akhirnya dapat mempertahankan keuntungan yang stabil di pasar nyata.
/*backtest
start: 2023-10-02 00:00:00
end: 2023-11-01 00:00:00
period: 1h
basePeriod: 15m
exchanges: [{"eid":"Futures_Binance","currency":"BTC_USDT"}]
*/

//@version=4

// This source code is subject to the terms of the Mozilla Public License 2.0 at https://mozilla.org/MPL/2.0/
// © MakeMoneyCoESTB2020- 1