Strategi VWAP berdasarkan jarak Z

Ringkasan
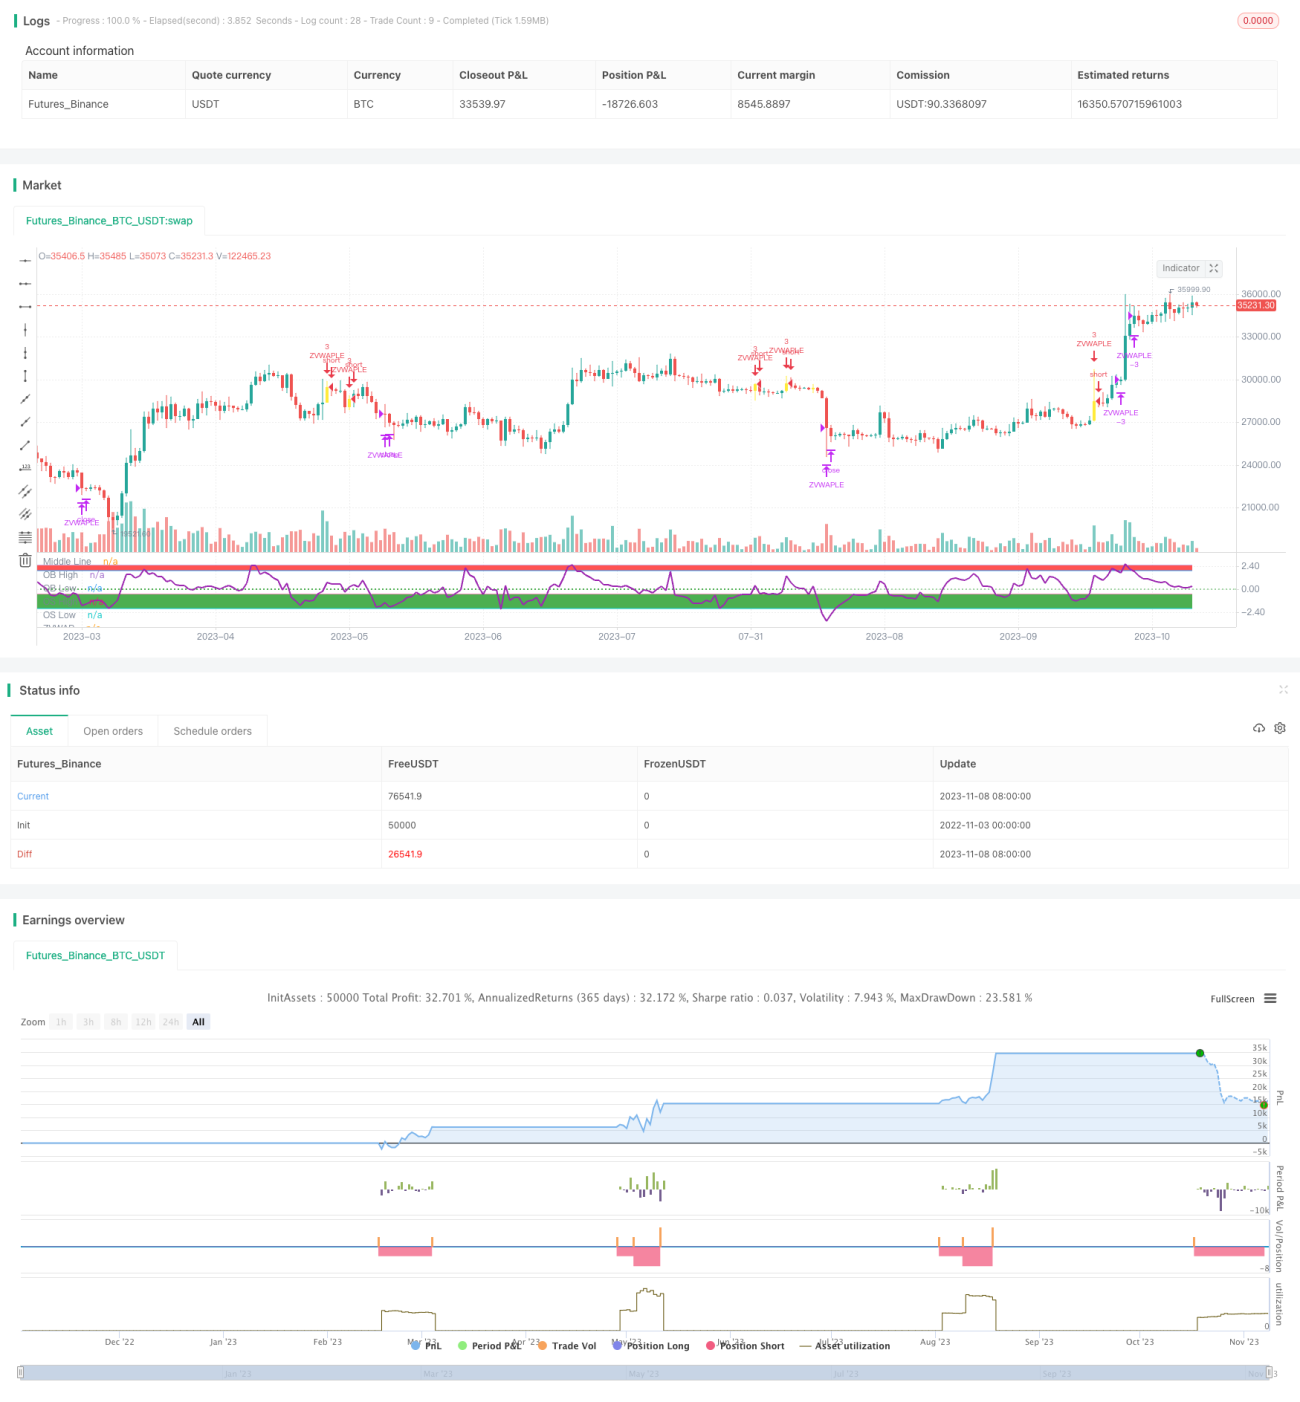
Strategi ini didasarkan pada LazyBear's Z-distance VWAP indicator, dengan menghitung harga dengan jarak Z-distance VWAP untuk menentukan apakah ada overbought atau oversold, dan melakukan entry entry. Strategi ini menambahkan penilaian EMA rata-rata dan Z-distance return to 0 axis, untuk menyaring beberapa sinyal noise.
Prinsip Strategi
- Menghitung nilai VWAP
- Perhitungan harga dengan jarak Z dari VWAP
- Setting over buy line (< 2.5) dan over sell line (< 0.5)
- Ketika garis cepat lebih besar dari garis lambat, Z jaraknya lebih rendah dari garis super, dan Z jaraknya lebih banyak saat melewati sumbu 0
- Saat Z berada di atas garis beli
- Menambahkan Stop Loss Logic
Fungsi utama:
- calc_zvwap: menghitung jarak Z dari harga ke VWAP
- Nilai VWAP: vwap (hlc3)
- "Saya tidak tahu apa-apa, saya tidak tahu apa-apa, saya tidak tahu apa-apa, saya tidak tahu apa-apa.
- (SlowEma)
Analisis Keunggulan
- Menggunakan jarak Z untuk lebih intuitif menilai overbuying dan overselling
- Tergabung dengan penyaringan EMA untuk menghindari penipuan
- Di sini, Anda dapat mengambil keuntungan dari tren.
- Logika Stop Loss untuk Mengontrol Risiko
Analisis risiko
- Pastikan pengaturan parameter masuk akal, seperti posisi overbought dan oversold, siklus EMA, dll.
- Z terlambat dari indikator, mungkin melewatkan titik jual beli yang penting
- Memungkinkan kenaikan suku bunga akan meningkatkan risiko kerugian
- Stop loss harus diatur dengan baik.
Solusi:
- Pengaturan parameter optimasi dengan pengukuran kembali
- Sinyal penyaringan dengan indikator tambahan
- Menetapkan kondisi taruhan yang masuk akal
- Dinamiskan posisi stop loss
Arah optimasi
- Optimalkan parameter siklus EMA
- Uji Kriteria Penilaian Overbuying dan Overselling yang Berbeda
- Tambahkan indikator lain untuk memfilter sinyal kebisingan
- Uji coba berbagai metode penghentian kerugian
- Optimalkan logika entry, gain, dan stop loss
Meringkaskan
Strategi ini menggunakan hubungan antara Z-distance untuk menentukan harga dan VWAP, digabungkan dengan sinyal kebisingan EMA untuk menangkap peluang tren. Strategi ini memungkinkan penargetan tren, sambil mengatur risiko pengendalian kerugian. Strategi ini dapat meningkatkan stabilitas strategi melalui pengoptimalan parameter dan penambahan indikator lain. Namun, ada masalah keterlambatan indikator Z-distance yang perlu dipertimbangkan saat pengoptimalan.
- 1