Strategi perdagangan kuantitatif RSI ganda


Tanggal Pembuatan: 2023-11-15 17:31:24 Akhirnya memodifikasi: 2023-11-15 17:31:24
menyalin: 0 Jumlah klik: 690
1
fokus pada
1617
Pengikut

Strategi perdagangan kuantitatif RSI ganda

Ringkasan

Strategi ini menggunakan indikator RSI ganda untuk perdagangan dua arah panjang dan pendek, sekaligus digabungkan dengan sistem garis rata untuk menentukan arah tren, termasuk dalam strategi kuantitatif RSI ganda. Strategi ini pertama-tama menggunakan indikator RSI untuk menentukan sinyal overbought, kemudian digabungkan dengan garis rata untuk menentukan arah tren dan memutuskan untuk melakukan overbought, termasuk dalam strategi pelacakan tren yang khas.

Analisis Prinsip

Strategi kuantitatif RSI ganda terutama menggunakan indikator RSI dua periode waktu untuk menentukan sinyal perdagangan. Strategi pertama-tama mengatur dua parameter RSI, satu periode yang lebih panjang sebagai penilaian perdagangan utama, dan satu periode yang lebih pendek sebagai penyaringan tambahan. Ketika RSI periode yang lebih panjang melintasi garis jual, sinyal yang lebih banyak dihasilkan, dan ketika RSI periode yang lebih pendek melintasi garis beli, sinyal yang lebih rendah dihasilkan.

Untuk memfilter sinyal palsu, strategi ini juga memperkenalkan SMA dan EMA untuk menilai tren. RSI harus dipertimbangkan untuk melakukan sinyal ganda hanya ketika garis SMA pendek melewati garis EMA panjang, dan sinyal RSI harus dipertimbangkan untuk melakukan sinyal shorting hanya ketika garis SMA pendek melewati garis EMA panjang, memastikan sinyal RSI ganda sesuai dengan arah tren, dan menghindari perdagangan kontra tren.

Selain itu, strategi ini juga mengatur logika stop loss. Setelah membuka posisi, dua stop loss yang berbeda akan ditampilkan secara bersamaan, dan posisi stop loss akan ditetapkan.

Analisis Keunggulan

Strategi kuantitatif RSI ganda memiliki keuntungan sebagai berikut:

  1. Indikator RSI dua periode waktu dapat lebih akurat menilai sinyal kosong. Kombinasi silang RSI periode panjang dan pendek, dapat menyaring beberapa sinyal palsu, meningkatkan kualitas sinyal.

  2. Sistem garis rata membantu menentukan arah tren besar, menghindari perdagangan melawan tren, dapat menyaring sebagian besar perdagangan bising, meningkatkan tingkat kemenangan.

  3. Mekanisme stop loss yang fleksibel, dapat menghasilkan keuntungan yang lebih tinggi dengan pengaturan stop loss yang berbeda, dan juga dapat menghentikan risiko.

  4. Strategi perdagangan logis sederhana dan jelas, mudah dipahami dan dioptimalkan, cocok untuk belajar trader kuantitatif.

Analisis risiko

Meskipun ada beberapa keuntungan dari strategi kuantitatif RSI ganda, ada juga risiko berikut:

  1. Indikator RSI sendiri tidak memiliki efek pada penilaian pergerakan dan pembalikan tren, dan strategi ini mungkin tidak efektif dalam perdagangan di pasar-pasar ini.

  2. Meskipun sistem rata-rata dapat menyaring kebisingan dalam kisaran kecil, namun tidak efektif dalam menilai perubahan tren siklus menengah, dan mungkin melewatkan titik balik tren.

  3. Penetapan stop loss yang tidak tepat dapat menyebabkan stop loss terlalu lebar atau stop loss terlalu kecil, mengurangi efektivitas strategi.

  4. Downgrade besar-besaran dapat menyebabkan kerugian yang lebih besar, dan perlu untuk mengontrol ukuran posisi.

Untuk risiko di atas, risiko dapat dikurangi dengan menyesuaikan parameter RSI, memperkenalkan indikator tren dan reversal yang lebih canggih, mengoptimalkan logika stop loss, dan mengendalikan posisi.

Arah optimasi

Strategi kuantitatif RSI ganda dapat dioptimalkan lebih lanjut dari beberapa arah:

  1. Mencoba berbagai kombinasi parameter, mengoptimalkan parameter RSI siklus, dan menemukan kombinasi indikator RSI periode panjang dan pendek yang optimal.

  2. Uji coba dengan berbagai indikator rata-rata, memperkenalkan indikator seperti MACD untuk menilai tren dan peluang pembalikan.

  3. Mengoptimalkan strategi stop loss, mengatur tracking stop loss, atau memindahkan stop loss agar stop loss lebih fleksibel.

  4. Menambahkan modul kontrol posisi, untuk mengontrol posisi shorting pada berbagai tahap dari tren siklus besar.

  5. Menambahkan model pembelajaran mesin untuk meningkatkan akurasi entri dan keluar.

  6. Optimalkan retrospeksi untuk menemukan varietas dan periode waktu transaksi yang optimal.

Meringkaskan

Strategi kuantitatif RSI ganda secara keseluruhan adalah strategi pelacakan tren yang khas. Ini menggabungkan strategi yang sangat klasik dan praktis untuk menilai sinyal perdagangan dengan indikator RSI ganda dan memfilter kebisingan sistem linier. Meskipun ada ruang untuk perbaikan strategi, logika operasi keseluruhan jelas, mudah dipahami dan dioptimalkan. Ini adalah strategi yang sangat cocok untuk belajar dan berlatih oleh pemula perdagangan kuantitatif.
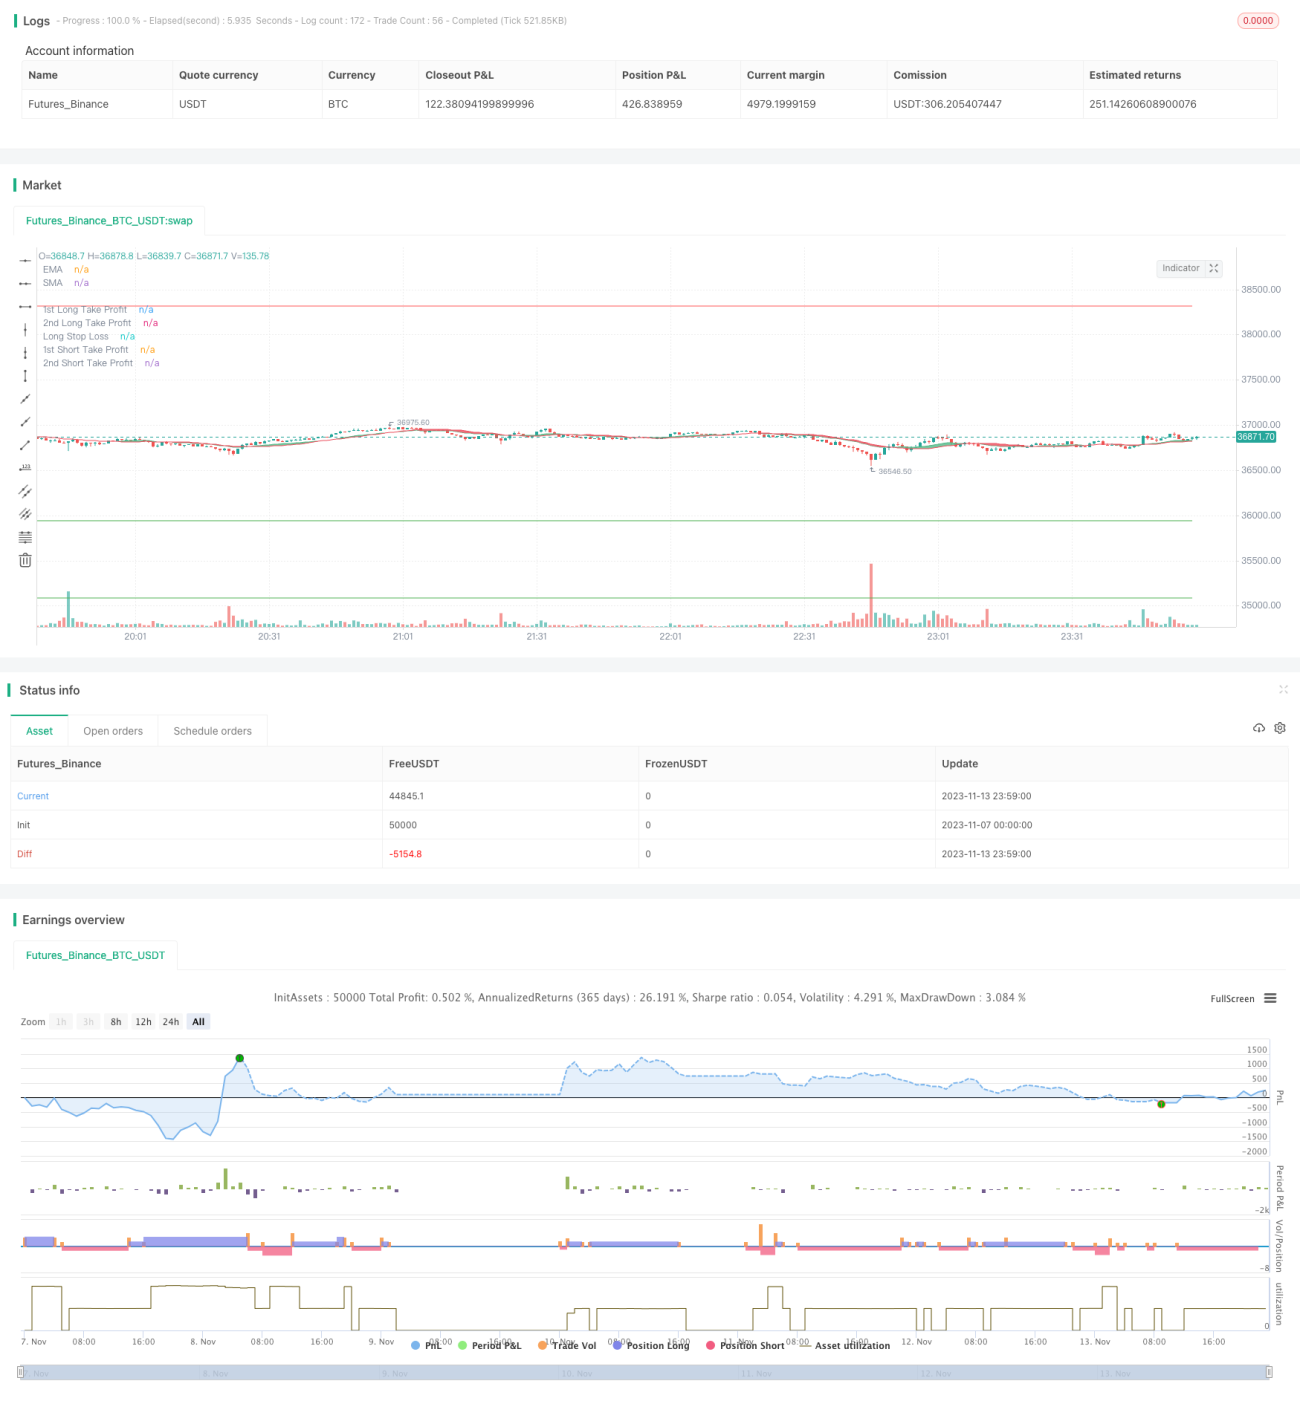
Kode Sumber Strategi
/*backtest
start: 2023-11-07 00:00:00
end: 2023-11-14 00:00:00
period: 1m
basePeriod: 1m
exchanges: [{"eid":"Futures_Binance","currency":"BTC_USDT"}]
*/

//@version=4
strategy("Growth Producer", overlay=true, initial_capital = 1000, currency = "USD", pyramiding = 2, commission_type=strategy.commission.percent, commission_value=0.07, default_qty_type = strategy.percent_of_equity, default_qty_value = 100)

//Functions
Atr(p) =>
    atr = 0.
    Tr = max(high - low, max(abs(high - close[1]), abs(low - close[1])))
    atr := nz(atr[1] + (Tr - atr[1])/p,Tr)

/// TREND
ribbon_period = input(19, "Period", step=1)

leadLine1 = ema(close, ribbon_period)
leadLine2 = sma(close, ribbon_period)

p1 = plot(leadLine1, color= #53b987, title="EMA", transp = 50, linewidth = 1)
p2 = plot(leadLine2, color= #eb4d5c, title="SMA", transp = 50, linewidth = 1)
fill(p1, p2, transp = 60, color = leadLine1 > leadLine2 ? #53b987 : #eb4d5c)

// Relative volatility index
length = input(120,"RVI period", minval=1), src = close
len = 14
stddev = stdev(src, length)
upper = ema(change(src) <= 0 ? 0 : stddev, len)
lower = ema(change(src) > 0 ? 0 : stddev, len)
rvi = upper / (upper + lower) * 100
benchmark = input(35, "RVI benchmark", minval=10, maxval=100, step=0.1)

// Plot RVI
// h0 = hline(80, "Upper Band", color=#C0C0C0)
// h1 = hline(20, "Lower Band", color=#C0C0C0)
// fill(h0, h1, color=#996A15, title="Background")
// offset = input(0, "Offset", type = input.integer, minval = -500, maxval = 500)
// plot(rvi, title="RVI", color=#008000, offset = offset)


/// MFI input
mfi_source = hlc3
mfi_length = input(19, "MFI Length", minval=1)
mfi_lower = input(15, "MFI Lower level", minval=0, maxval=50)
mfi_upper = input(90, "MFI Higher level", minval=50, maxval=100)


// MFI
upper_s = sum(volume * (change(mfi_source) <= 0 ? 0 : mfi_source), mfi_length)
lower_s = sum(volume * (change(mfi_source) >= 0 ? 0 : mfi_source), mfi_length)
mf = rsi(upper_s, lower_s)
// mfp = plot(mf, color=color.new(color.gray,0), linewidth=1)
// top = hline(mfi_upper, color=color.new(color.gray, 100), linewidth=1, editable=false)
// bottom = hline(mfi_lower, color=color.new(color.gray,100), linewidth=1, editable=false)
// hline(0, color=color.new(color.black,100), editable=false)
// hline(100, color=color.new(color.black,100), editable=false)

// Breaches
// b_color = (mf > mfi_upper) ? color.new(color.red,70) : (mf < mfi_lower) ? color.new(color.green,60) : na
// bgcolor(HighlightBreaches ? b_color : na)

// fill(top, bottom, color=color.gray, transp=75)

// Initial inputs
Act_RSI_VWAP_long = input(true, "RSI VOLUME WEIGHTED AVERAGE PRICE LONG")
RSI_VWAP_length_long = input(16, "RSI-VWAP LENGTH LONG")
RSI_VWAP_overSold_long = input(13, "RSI-VWAP OVERSOLD LONG", type=input.float)
RSI_VWAP_overBought_long = input(68, "RSI-VWAP OVERBOUGHT LONG", type=input.float)

Act_RSI_VWAP_short = input(true, "RSI VOLUME WEIGHTED AVERAGE PRICE SHORT")
RSI_VWAP_length_short = input(14, "RSI-VWAP LENGTH SHORT")
RSI_VWAP_overSold_short = input(7, "RSI-VWAP OVERSOLD SHORT", type=input.float)
RSI_VWAP_overBought_short = input(68, "RSI-VWAP OVERBOUGHT SHORT", type=input.float)

// RSI with VWAP as source
RSI_VWAP_long = rsi(vwap(close), RSI_VWAP_length_long)
RSI_VWAP_short = rsi(vwap(close), RSI_VWAP_length_short)

// Plot Them Separately.
// Plotting LONG, Put overlay=false
// r=plot(RSI_VWAP_long, color = RSI_VWAP_long > RSI_VWAP_overBought_long ? color.red : RSI_VWAP_lnog < RSI_VWAP_overSold_long ? color.lime : color.blue, title="rsi", linewidth=2, style=plot.style_line)
// h1=plot(RSI_VWAP_overBought_long, color = color.gray, style=plot.style_stepline)
// h2=plot(RSI_VWAP_overSold_long, color = color.gray, style=plot.style_stepline)
// fill(r,h1, color = RSI_VWAP_long > RSI_VWAP_overBought_long ? color.red : na, transp = 60)
// fill(r,h2, color = RSI_VWAP_long < RSI_VWAP_overSold_long ? color.lime : na, transp = 60)

// Plotting SHORT, Put overlay=false
// r=plot(RSI_VWAP_short, color = RSI_VWAP_short > RSI_VWAP_overBought_short ? color.red : RSI_VWAP_short < RSI_VWAP_overSold_short ? color.lime : color.blue, title="rsi", linewidth=2, style=plot.style_line)
// h1=plot(RSI_VWAP_overBought_short, color = color.gray, style=plot.style_stepline)
// h2=plot(RSI_VWAP_overSold_short, color = color.gray, style=plot.style_stepline)
// fill(r,h1, color = RSI_VWAP_short > RSI_VWAP_overBought_short ? color.red : na, transp = 60)
// fill(r,h2, color = RSI_VWAP_short < RSI_VWAP_overSold_short ? color.lime : na, transp = 60)


///////  STRATEGY Take Profit / Stop Loss ////////
////// LONG //////

long_tp1_inp = input(3.3, title='Long Take Profit 1 %', step=0.1)/100
long_tp1_qty = input(15, title="Long Take Profit 1 Qty", step=1)

long_tp2_inp = input(12, title='Long Take Profit 2%', step=0.1)/100
long_tp2_qty = input(100, title="Long Take Profit 2 Qty", step=1)

long_sl_inp = input(3.3, title='Long Stop Loss %', step=0.1)/100

long_take_level_1 = strategy.position_avg_price * (1 + long_tp1_inp)
long_take_level_2 = strategy.position_avg_price * (1 + long_tp2_inp)
long_stop_level = strategy.position_avg_price * (1 - long_sl_inp)

////// SHORT //////
short_tp1_inp = input(3.2, title='Short Take Profit 1 %', step=0.1)/100
short_tp1_qty = input(20, title="Short Take Profit 1 Qty", step=1)

short_tp2_inp = input(5.5, title='Short Take Profit 2%', step=0.1)/100
short_tp2_qty = input(100, title="Short Take Profit 2 Qty", step=1)

short_sl_inp = input(3.2, title='Short Stop Loss %', step=0.1)/100

short_take_level_1 = strategy.position_avg_price * (1 - short_tp1_inp)
short_take_level_2 = strategy.position_avg_price * (1 - short_tp2_inp)
short_stop_level = strategy.position_avg_price * (1 + short_sl_inp)


///Strategy_Conditions
/// LONG ///
entry_long =(crossover(RSI_VWAP_long, RSI_VWAP_overSold_long) and leadLine2<leadLine1) or (crossunder(mf,mfi_lower) and leadLine2<leadLine1)
entry_price_long=valuewhen(entry_long,close,0)
exit_long =crossunder(RSI_VWAP_long, RSI_VWAP_overBought_long)

/// SHORT ///

entry_short =crossunder(RSI_VWAP_short, RSI_VWAP_overBought_short) and leadLine2>leadLine1 or (crossover(mf,mfi_upper) and leadLine2>leadLine1)
entry_price_short=valuewhen(entry_short,close,0)
exit_short =crossover(RSI_VWAP_short, RSI_VWAP_overSold_short)

////// BACKTEST PERIOD ///////
testStartYear = input(2019, "Backtest Start Year")
testStartMonth = input(1, "Backtest Start Month")
testStartDay = input(1, "Backtest Start Day")
testPeriodStart = timestamp(testStartYear,testStartMonth,testStartDay,0,0)

testStopYear = input(2020, "Backtest Stop Year")
testStopMonth = input(12, "Backtest Stop Month")
testStopDay = input(31, "Backtest Stop Day")
testPeriodStop = timestamp(testStopYear,testStopMonth,testStopDay,0,0)

testPeriod() => true

if testPeriod()

    if strategy.position_size == 0 or strategy.position_size > 0 and rvi>benchmark
        strategy.entry("long", true, when = entry_long, comment="Insert Enter Long Comment")
    strategy.exit("TP1","long", qty_percent=long_tp1_qty, limit=long_take_level_1, stop=long_stop_level)
    strategy.exit("TP2","long", qty_percent=long_tp2_qty, limit=long_take_level_2, stop=long_stop_level)
    strategy.close("long", when=exit_long, comment = "Insert Exit Long Comment")

    if strategy.position_size == 0 or strategy.position_size < 0 and rvi>benchmark
        strategy.entry("short", false, when = entry_short, comment="Insert Enter Short Comment")
    strategy.exit("TP1","short", qty_percent=short_tp1_qty, limit=short_take_level_1, stop=short_stop_level)
    strategy.exit("TP2","short", qty_percent=short_tp2_qty, limit=short_take_level_2, stop=short_stop_level)
    strategy.close("short", when=exit_short, comment = "Insert Exit Short Comment")


// LONG POSITION
plot(strategy.position_size > 0 ? long_take_level_1 : na, style=plot.style_linebr, color=color.green, linewidth=1, title="1st Long Take Profit")
plot(strategy.position_size > 0 ? long_take_level_2 : na, style=plot.style_linebr, color=color.green, linewidth=1, title="2nd Long Take Profit")
plot(strategy.position_size > 0 ? long_stop_level : na, style=plot.style_linebr, color=color.red, linewidth=1, title="Long Stop Loss")


// SHORT POSITION
plot(strategy.position_size < 0 ? short_take_level_1 : na, style=plot.style_linebr, color=color.green, linewidth=1, title="1st Short Take Profit")
plot(strategy.position_size < 0 ? short_take_level_2 : na, style=plot.style_linebr, color=color.green, linewidth=1, title="2nd Short Take Profit")
plot(strategy.position_size < 0 ? short_stop_level : na, style=plot.style_linebr, color=color.red, linewidth=1, title="Long Stop Loss")