Strategi perdagangan kuantitatif berdasarkan perbandingan harga penutupan harian

Ringkasan
Strategi ini dikenal sebagai strategi perbandingan harga penutupan garis harian. Ini adalah strategi kuantitatif untuk membuat keputusan perdagangan berdasarkan harga penutupan garis harian. Strategi ini menghasilkan sinyal perdagangan dengan menghitung selisih harga penutupan garis harian saat ini dan harga penutupan garis sehari sebelumnya.
Prinsip Strategi
Logika inti dari strategi ini adalah membandingkan harga penutupan K-line saat ini dengan harga penutupan K-line sebelumnya. Secara khusus:
- Hitung perbedaan harga penutupan hari dan penutupan hari sebelumnya (today - yesterday)
- Perhitungan perbedaan dengan rasio harga penutupan hari sebelumnya (difference / yesterday's close)
- Jika rasio lebih besar dari batas positif yang ditetapkan, maka akan dihasilkan sinyal beli; jika rasio lebih kecil dari batas negatif yang ditetapkan, maka akan dihasilkan sinyal jual
- Berdasarkan sinyal masuk melakukan lebih atau kosong gudang bagian
Strategi ini tidak menetapkan kondisi stop loss dan stop loss, dan bergantung pada sinyal perdagangan yang dibentuk oleh kondisi penurunan nilai untuk masuk dan posisi damai.
Analisis Keunggulan
- Pemikiran sederhana dan mudah dipahami, cocok untuk pemula dalam trading kuantitatif
- Berdagang hanya berdasarkan harga close-out, hindari terlalu sering berdagang
- Frekuensi transaksi dapat dikontrol dengan penyesuaian nilai tukar
Analisis risiko
- Tidak ada pengaturan stop loss, tidak bisa mengendalikan kerugian tunggal
- Bisa menghasilkan sinyal perdagangan berturut-turut yang menyebabkan overtrading
- Penarikan mungkin lebih besar dan tidak dapat mengontrol kerugian secara keseluruhan.
Arah optimasi
- Menambahkan logika stop loss untuk mengendalikan kerugian tunggal
- Meningkatkan pembatasan untuk menghindari perdagangan berlebihan
- Parameter optimasi untuk menemukan frekuensi perdagangan yang optimal
Meringkaskan
Strategi ini membentuk sinyal perdagangan dengan membandingkan harga close out, idealnya sederhana, cocok untuk pembelajaran pemula. Namun, strategi ini memiliki risiko tertentu dan perlu dioptimalkan lebih lanjut untuk perdagangan di pasar.
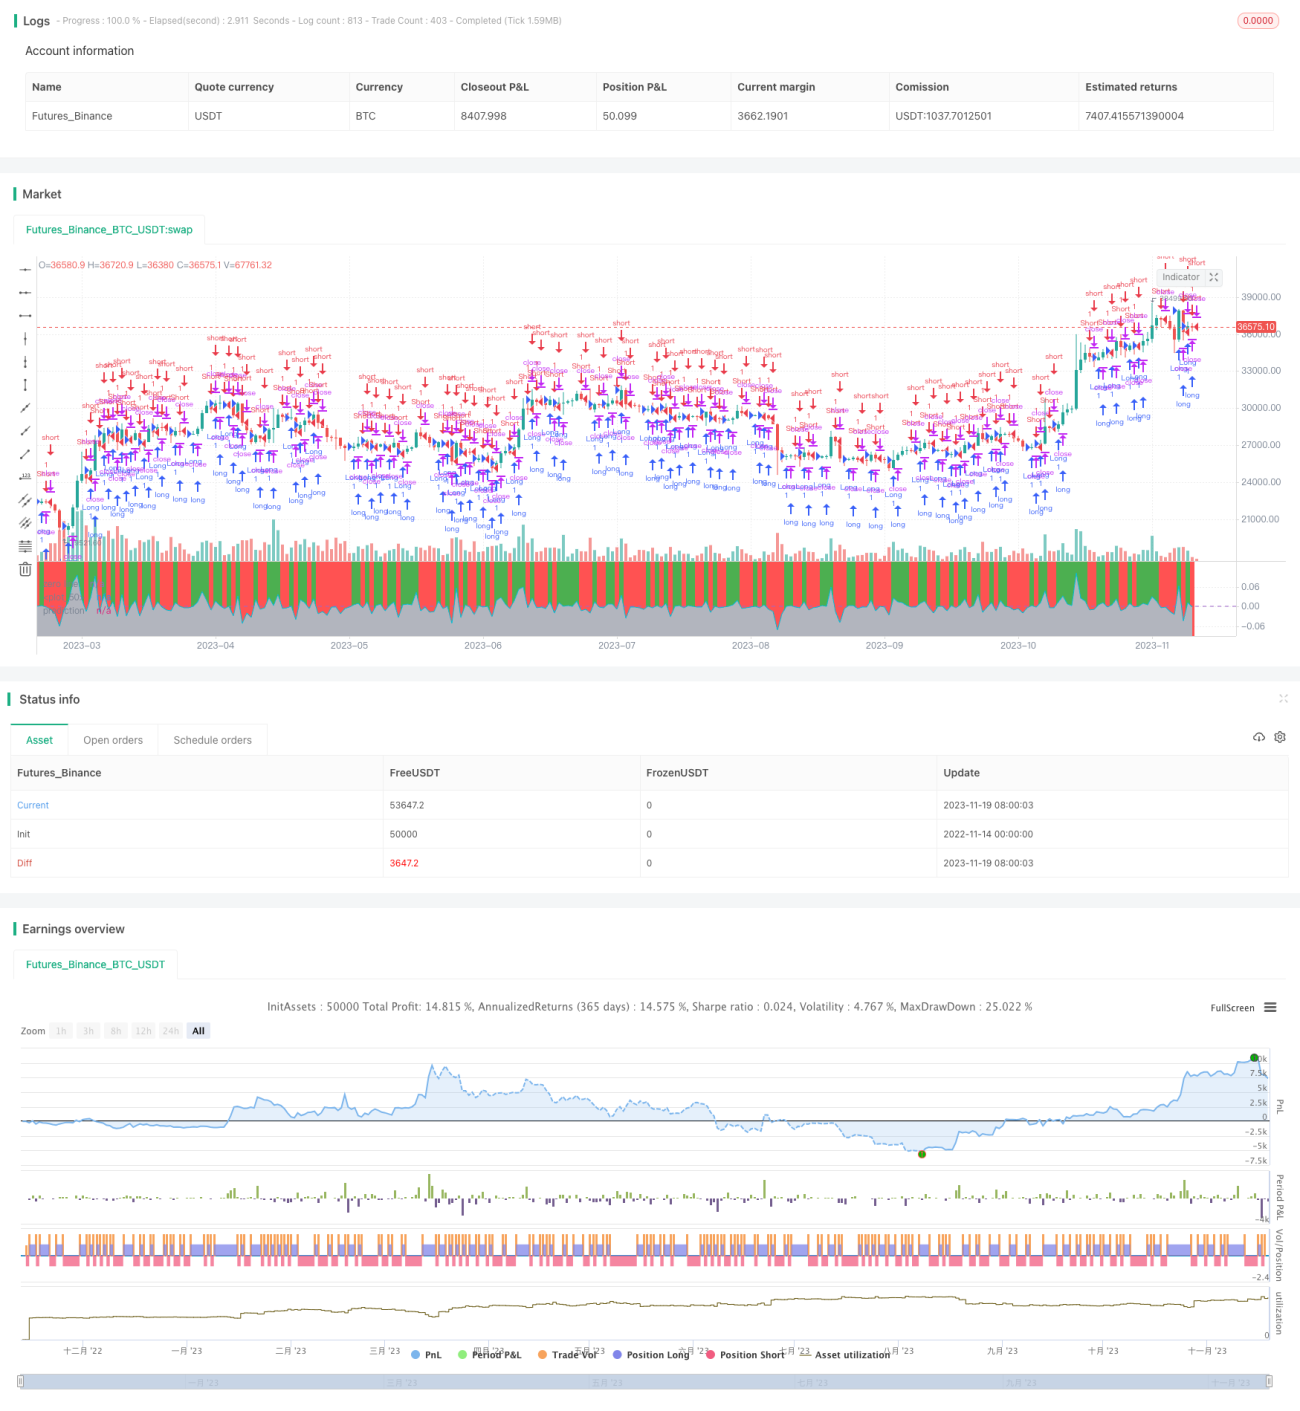
/*backtest
start: 2022-11-14 00:00:00
end: 2023-11-20 00:00:00
period: 1d
basePeriod: 1h
exchanges: [{"eid":"Futures_Binance","currency":"BTC_USDT"}]
*/

//@version=2
strategy("Daily Close Comparison Strategy (by ChartArt) correct results", shorttitle="CA_-_Daily_Close_Strat", overlay=false)

// ChartArt's Daily Close Comparison Strategy- 1