Strategi Bollinger Bands Golden Cross dan Dead Cross

Ringkasan
Strategi ini didasarkan pada Bollinger Bands Gold Fork Dead Fork untuk melakukan lebih banyak shorting. Ketika harga menembus Bollinger Bands ke arah atas, shorting; Ketika harga menembus Bollinger Bands ke arah bawah, overdoing. Selama memegang posisi, akan dilakukan penambahan posisi dan stop loss tracking.
Prinsip Strategi
Strategi ini menggunakan 3 lintasan atas dan bawah dari Brin Belt. Lintasan tengah dari Brin Belt adalah rata-rata bergerak n hari, lintasan atas adalah lintasan tengah + k kali perbedaan standar n hari, lintasan bawah adalah lintasan tengah - k kali perbedaan standar n hari.
Ketika harga turun dari bawah ke atas, menunjukkan bahwa harga mulai naik, maka lakukan lebih banyak; ketika harga turun dari atas ke bawah, menunjukkan bahwa harga mulai turun, maka lakukan lebih banyak.
Setelah melakukan short over, maka akan dilanjutkan dengan melakukan up position. Kondisi untuk melakukan up position adalah berdasarkan pada posisi yang telah dipegang. Jika harga kembali menyentuh garis rata-rata, maka akan dibuka lagi posisi untuk melakukan over atau short over.
Stop loss tracking juga akan diperbarui secara real time untuk semua pemegang saham. Stop loss line akan diatur berdasarkan perbedaan antara harga rata-rata pemegang saham saat ini dengan harga Brin.
Analisis Keunggulan
Strategi ini memiliki keuntungan sebagai berikut:
- Menggunakan indikator BRI, dapat menangkap harga terobosan, melakukan lebih banyak shorting dengan tepat
- Pengakuan resmi masuk dengan menggunakan metode garpu emas
- "Kalau Anda memiliki saham, Anda bisa mendapatkan lebih banyak uang.
- Pembaruan real-time stop loss, menghindari stop loss dari shock
Analisis risiko
Strategi ini juga memiliki beberapa risiko:
- Bollinger Bands, sebagai indikator, lebih sensitif terhadap pergerakan pasar dan mungkin akan dieksploitasi.
- Cara berhijair meningkatkan risiko, dan kerugian akan diperbesar
- Garis mati tidak mutlak, tetapi ada kemungkinan untuk ditempatkan.
Ada beberapa cara untuk mengoptimalkan risiko ini:
- Menyesuaikan parameter Brinstrand dengan siklus yang berbeda
- Tingkat dan frekuensi optimasi penambahan
- Menambahkan rel tengah sebagai jalur penghentian lebih lanjut
Arah optimasi
Strategi ini dapat dioptimalkan dalam beberapa hal:
- Optimalkan parameter Brin Belt untuk lebih banyak lingkungan pasar
- Mengoptimalkan logika investasi, menyeimbangkan risiko dan keuntungan
- Menambahkan stop loss, seperti stop loss di rel tengah
- Meningkatkan Strategi Penanggulangan, Meningkatkan Aktivitas Penanggulangan
- Filter waktu masuk dengan indikator lainnya
- Optimalkan pengelolaan dana, kendalikan risiko tunggal
Meringkaskan
Strategi ini secara keseluruhan adalah strategi pelacakan tren yang khas. Strategi ini dapat berjalan secara berurutan dan mendapatkan keuntungan ketika tren muncul. Namun, strategi ini juga memiliki risiko tertentu yang perlu dioptimalkan dan diperbaiki lebih lanjut untuk menyesuaikan diri dengan lebih banyak situasi pasar dan mengurangi risiko yang ditimbulkan oleh terobosan palsu.
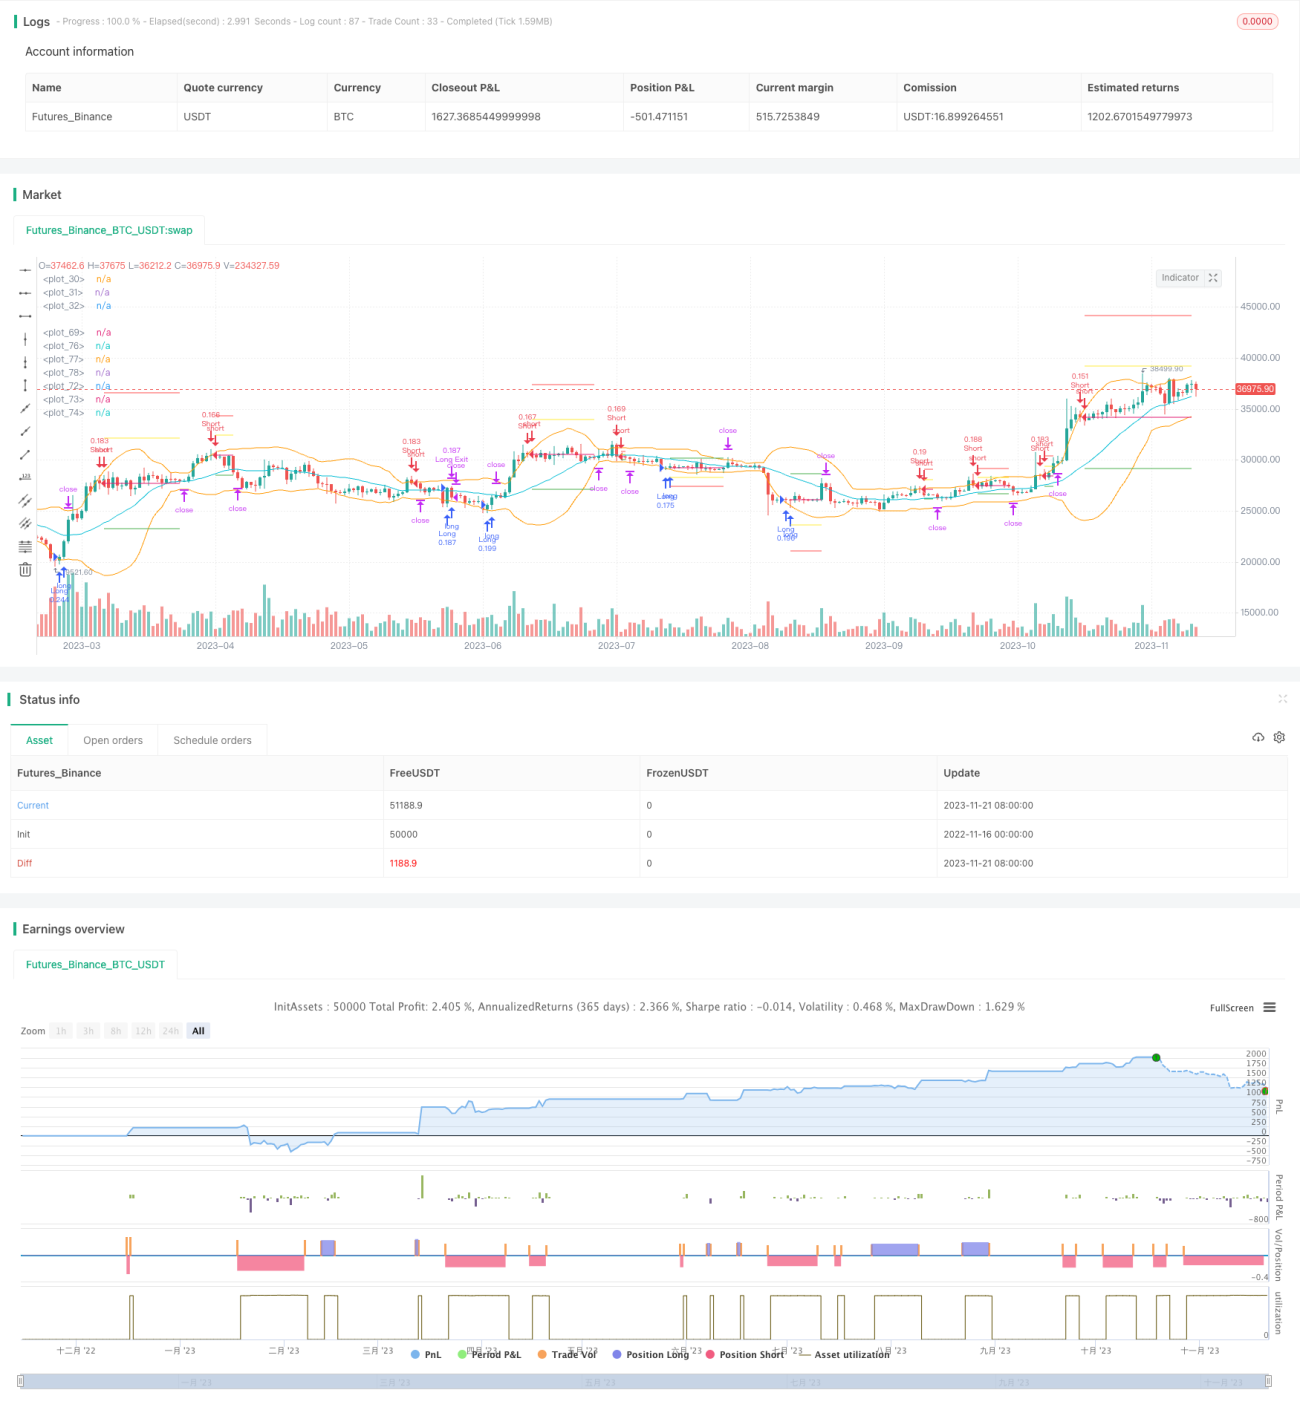
/*backtest
start: 2022-11-16 00:00:00
end: 2023-11-22 00:00:00
period: 1d
basePeriod: 1h
exchanges: [{"eid":"Futures_Binance","currency":"BTC_USDT"}]
*/

//@version=5

strategy(title='Bollinger Band strategy with split, limit, stop', shorttitle='bb strategy', overlay=true,commission_type = strategy.commission.percent, commission_value = 0.01, default_qty_type = strategy.percent_of_equity, default_qty_value = 10, pyramiding = 4)
- 1