Strategi terobosan kejutan tren super lintas kerangka waktu
Ringkasan
Strategi ini menggabungkan indikator supertrend dengan indikator Brin Belt dalam beberapa frame waktu, mengidentifikasi arah tren dan titik-titik resistensi pendukung utama, melakukan Entries pada saat terjatuh, dan berdasarkan posisi keluar silang. Strategi ini terutama berlaku untuk varietas komoditas berjangka yang berfluktuasi tinggi, seperti emas, perak, minyak mentah, dll.
Prinsip Strategi
Fungsi supertrend multi-timeframe khusus yang ditulis berdasarkan Pine Scriptpine_supertrend(), supertrend yang menggabungkan periode yang berbeda (misalnya 1 menit dan 5 menit), untuk menentukan arah tren siklus besar.
Pada saat yang sama, menghitung Bollinger Bands di bawah rel, untuk melakukan penilaian terobosan saluran. Ketika harga menembus Bollinger Bands di atas rel, dianggap berada di posisi bullish; Ketika harga jatuh di bawah Bollinger Bands di bawah rel, dianggap sebagai terobosan bearish.
Sinyal strategis:
Sinyal multihead: harga close > Brin berlari ke jalur dan close > indikator super trend multi-frame Sinyal kosong: harga penutupan < Brin band downtrack dan harga penutupan < Multi-time frame super trend indicator
Stop loss:
Stop loss multihead: harga penutupan < 5 menit indikator supertrend Stop loss kosong: harga penutupan > 5 menit indikator tren super
Oleh karena itu, strategi untuk menangkap terobosan resonansi antara indikator supertrend dan indikator BRI, untuk memproses transaksi dalam situasi yang sangat berfluktuasi.
Analisis Keunggulan
- Menggunakan indikator supertrend multi-frame waktu untuk menentukan arah tren siklus besar, meningkatkan kualitas sinyal
- Brin yang berada di atas dan di bawah rel sebagai titik resistensi pendukung utama, dapat mengurangi false breaks
- Indikator Supertrend sebagai Stop Loss, Mengurangi Kerugian, Mengontrol Risiko
Analisis risiko
- Indikator supertrend mengalami keterlambatan dan mungkin melewatkan titik baliknya.
- Setelan parameter Brin-band yang tidak tepat dapat menyebabkan terlalu sering atau terlalu banyak kehilangan perdagangan
- Komoditas berjangka harga berfluktuasi tajam, mudah terhalang pada malam hari atau saat terjadi peristiwa besar
Solusi untuk Mengatasi Risiko:
- Kombinasi sinyal konfirmasi dengan berbagai indikator bantu untuk menghindari penembusan palsu
- Optimalkan parameter Brin untuk mencari titik keseimbangan yang optimal
- Sesuaikan posisi stop loss dan perpanjang jarak stop loss
Arah optimasi
- Cobalah indikator tren lainnya seperti KDJ, MACD dan lain-lain sebagai penilaian tambahan.
- Meningkatkan probabilitas penilaian model pembelajaran mesin sebagai bantuan
- Optimalkan parameter untuk menemukan kombinasi superparameter yang optimal
Meringkaskan
Strategi ini mengintegrasikan supertrend dengan dua indikator yang sangat efisien di Brin Belt, untuk mencapai operasi probabilitas tinggi melalui analisis kerangka waktu dan penilaian terobosan saluran. Strategi ini secara efektif mengendalikan risiko dana, dan telah terbukti dapat menghasilkan keuntungan yang lebih baik di varietas yang sangat berfluktuasi. Efektivitas strategi dapat ditingkatkan dengan lebih lanjut mengoptimalkan dan menggabungkan INDICATORS.
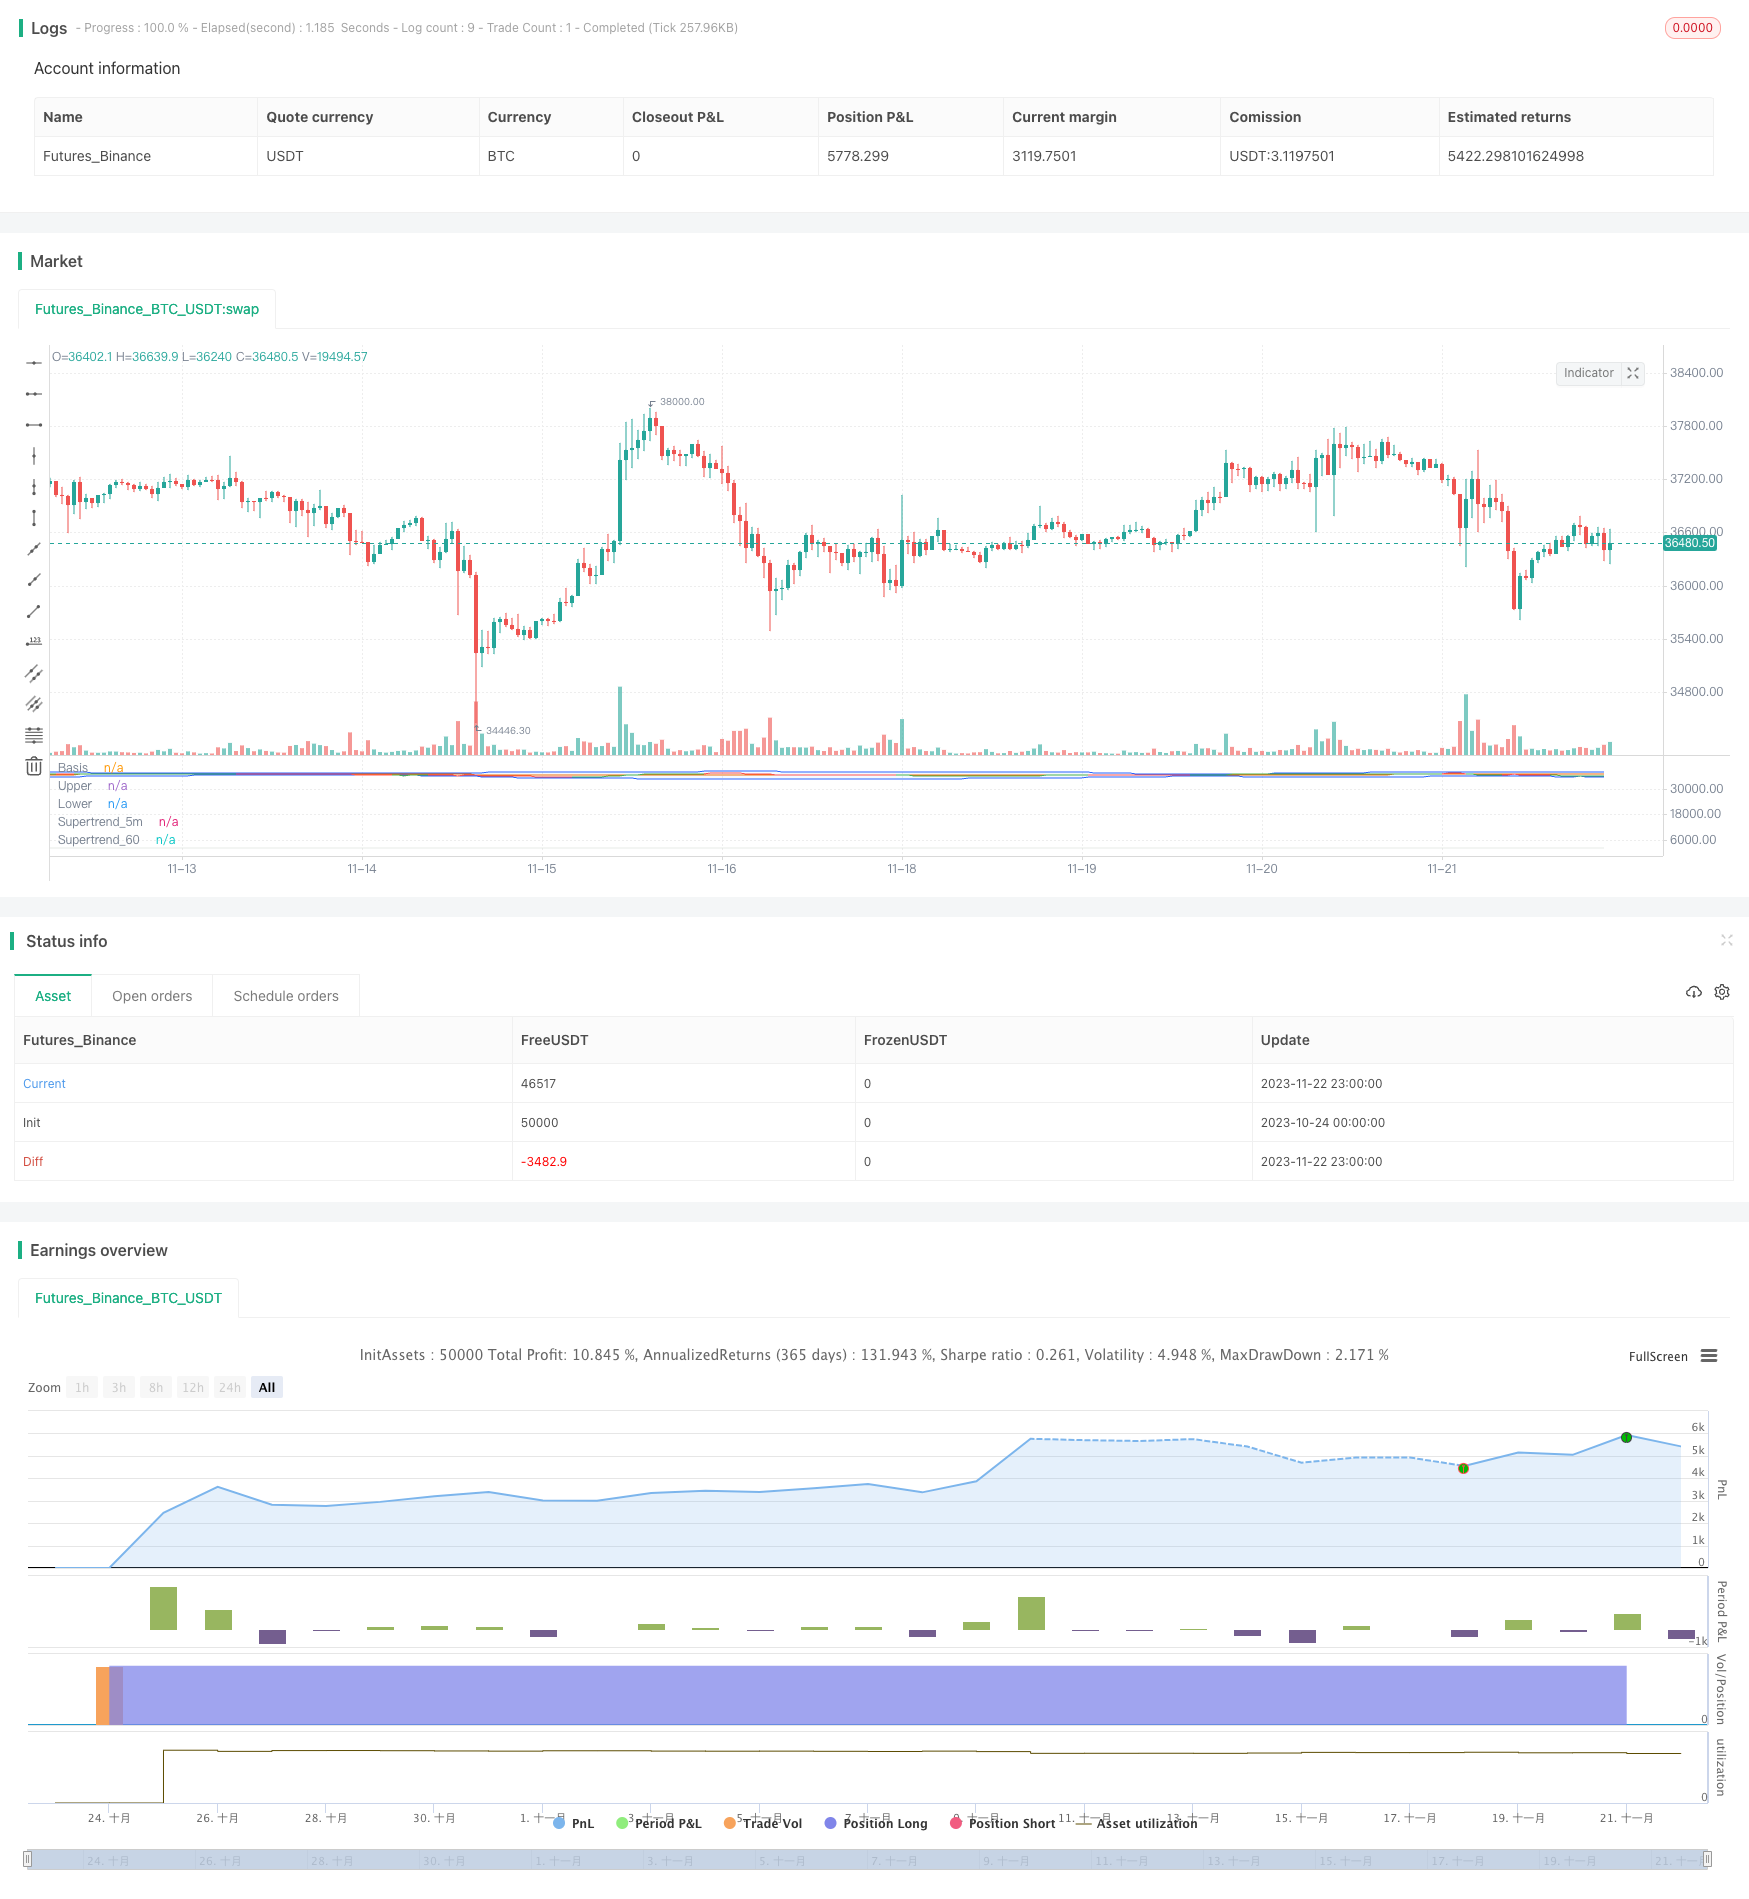
/*backtest
start: 2023-10-24 00:00:00
end: 2023-11-23 00:00:00
period: 1h
basePeriod: 15m
exchanges: [{"eid":"Futures_Binance","currency":"BTC_USDT"}]
*/

// This source code is subject to the terms of the Mozilla Public License 2.0 at https://mozilla.org/MPL/2.0/
// © ambreshc95

//@version=5
strategy("Comodity_SPL_Strategy_01", overlay=false)

// function of st
// [supertrend, direction] = ta.supertrend(3, 10)
// plot(direction < 0 ? supertrend : na, "Up direction", color = color.green, style=plot.style_linebr)
// plot(direction > 0 ? supertrend : na, "Down direction", color = color.red, style=plot.style_linebr)

// VWAP
// src_vwap = input(title = "Source", defval = hlc3, group="VWAP Settings")
// [_Vwap,stdv,_] = ta.vwap(src_vwap,false,1)
// plot(_Vwap, title="VWAP", color = color.rgb(0, 0, 0))


// The same on Pine Script®
pine_supertrend(factor, atrPeriod,len_ma) =>

    h= ta.sma(high,len_ma)
    l= ta.sma(low,len_ma)
    hlc_3 = (h+l)/2
    src = hlc_3
    atr = ta.atr(atrPeriod)
    upperBand = src + factor * atr
    lowerBand = src - factor * atr
    prevLowerBand = nz(lowerBand[1])
    prevUpperBand = nz(upperBand[1])

    lowerBand := lowerBand > prevLowerBand or close[1] < prevLowerBand ? lowerBand : prevLowerBand
    upperBand := upperBand < prevUpperBand or close[1] > prevUpperBand ? upperBand : prevUpperBand
    int direction = na
    float superTrend = na
    prevSuperTrend = superTrend[1]
    if na(atr[1])
        direction := 1
    else if prevSuperTrend == prevUpperBand
        direction := close > upperBand ? -1 : 1
    else
        direction := close < lowerBand ? 1 : -1
    superTrend := direction == -1 ? lowerBand : upperBand
    [superTrend, direction]
len_ma_given = input(75, title="MA_SMA_ST")
[Pine_Supertrend, pineDirection] = pine_supertrend(3, 10,len_ma_given)
// plot(pineDirection < 0 ? Pine_Supertrend : na, "Up direction", color = color.green, style=plot.style_linebr)
// plot(pineDirection > 0 ? Pine_Supertrend : na, "Down direction", color = color.red, style=plot.style_linebr)
//
// Define Supertrend parameters
atrLength = input(10, title="ATR Length")
factor = input(3.0, title="Factor")

// // Calculate Supertrend
[supertrend, direction] = ta.supertrend(factor, atrLength)

st_color = supertrend > close ? color.red : color.green
// // Plot Supertrend
// plot(supertrend, "Supertrend", st_color)
//

// BB Ploting
length = input.int(75, minval=1)
maType = input.string("SMA", "Basis MA Type", options = ["SMA", "EMA", "SMMA (RMA)", "WMA", "VWMA"])
src = input(close, title="Source")
mult = input.float(2.5, minval=0.001, maxval=50, title="StdDev")

ma(source, length, _type) =>
    switch _type
        "SMA" => ta.sma(source, length)
        "EMA" => ta.ema(source, length)
        "SMMA (RMA)" => ta.rma(source, length)
        "WMA" => ta.wma(source, length)
        "VWMA" => ta.vwma(source, length)

basis = ma(src, length, maType)
dev = mult * ta.stdev(src, length)
upper = basis + dev
lower = basis - dev
offset = input.int(0, "Offset", minval = -500, maxval = 500)
plot(basis, "Basis", color=#FF6D00, offset = offset)
p1 = plot(upper, "Upper", color=#2962FF, offset = offset)
p2 = plot(lower, "Lower", color=#2962FF, offset = offset)
fill(p1, p2, title = "Background", color=color.rgb(33, 150, 243, 95))


// h= ta.sma(high,60)
// l= ta.sma(low,60)
// c= sma(close,60)
// hlc_3 = (h+l)/2
// supertrend60 = request.security(syminfo.tickerid,  supertrend)

// // Define timeframes for signals
tf1 = input(title="Timeframe 1", defval="1")
tf2 = input(title="Timeframe 2",defval="5")
// tf3 = input(title="Timeframe 3",defval="30")


// // // Calculate Supertrend on multiple timeframes
supertrend_60 = request.security(syminfo.tickerid, tf1, Pine_Supertrend)
supertrend_5m = request.security(syminfo.tickerid, tf2, supertrend)
// supertrend3 = request.security(syminfo.tickerid, tf3, supertrend)

// // Plot Supertrend_60
st_color_60 = supertrend_60 > close ? color.rgb(210, 202, 202, 69) : color.rgb(203, 211, 203, 52)
plot(supertrend_60, "Supertrend_60", st_color_60)

// // Plot Supertrend_5m
st_color_5m = supertrend_5m > close ? color.red : color.green
plot(supertrend_5m, "Supertrend_5m", st_color_5m)


ma21 = ta.sma(close,21)
// rsi = ta.rsi(close,14)
// rsima = ta.sma(rsi,14)

// Define the Indian Standard Time (IST) offset from GMT
ist_offset = 5.5 // IST is GMT+5:30

// Define the start and end times of the trading session in IST
// start_time = timestamp("GMT", year, month, dayofmonth, 10, 0) + ist_offset * 60 * 60
// end_time = timestamp("GMT", year, month, dayofmonth, 14, 0) + ist_offset * 60 * 60
// Check if the current time is within the trading session
// in_trading_session = timenow >= start_time and timenow <= end_time

in_trading_session = not na(time(timeframe.period, "0945-1430"))
// bgcolor(inSession ? color.silver : na)
out_trading_session = not na(time(timeframe.period, "1515-1530"))
// // // Define buy and sell signals
buySignal = close>upper and close > supertrend_5m and close > supertrend_60 and close > ma21  and in_trading_session //close > supertrend and
sellSignal = close<lower and close < supertrend_5m and close < supertrend_60 and close < ma21  and in_trading_session //close < supertrend and

var bool long_position = false
var bool long_exit = false
var float long_entry_price = 0
var float short_entry_price = 0

if buySignal and not long_position
    // label.new(bar_index, na, yloc = yloc.belowbar, style = label.style_label_up, color = color.green, size = size.small)
    long_position := true
    strategy.entry("Buy",strategy.long)

long_exit := (close < supertrend_5m)
if long_position and long_exit
    // label.new(bar_index, na, yloc = yloc.belowbar, style = label.style_xcross, color = color.green, size = size.tiny)
    long_position := false
    strategy.exit("Exit","Buy",stop = close)

var bool short_position = false
var bool short_exit = false
if sellSignal and not short_position
    // label.new(bar_index, na, yloc = yloc.abovebar, style = label.style_label_down, color = color.red, size = size.small)
    short_position := true
    strategy.entry("Sell",strategy.short)

short_exit := (close > supertrend_5m)
if short_position and short_exit
    // label.new(bar_index, na, yloc = yloc.belowbar, style = label.style_xcross, color = color.red, size = size.tiny)
    short_position := false
    strategy.exit("Exit","Sell", stop = close)

if out_trading_session
    long_position := false
    strategy.exit("Exit","Buy",stop = close)
    short_position := false
    strategy.exit("Exit","Sell", stop = close)

// if long_position
//     long_entry_price := close[1] + 50//bar_index

// if short_position
//     short_entry_price := close[1] - 50//bar_index

// if (long_position and high[1] > long_entry_price)
//     label.new(bar_index, na, yloc = yloc.abovebar, style = label.style_triangledown, color = color.yellow, size = size.tiny)

// if (short_position and low[1] < short_entry_price)
//     label.new(bar_index, na, yloc = yloc.belowbar, style = label.style_triangleup, color = color.yellow, size = size.tiny)