Strategi mengikuti tren berdasarkan kNN

Ringkasan
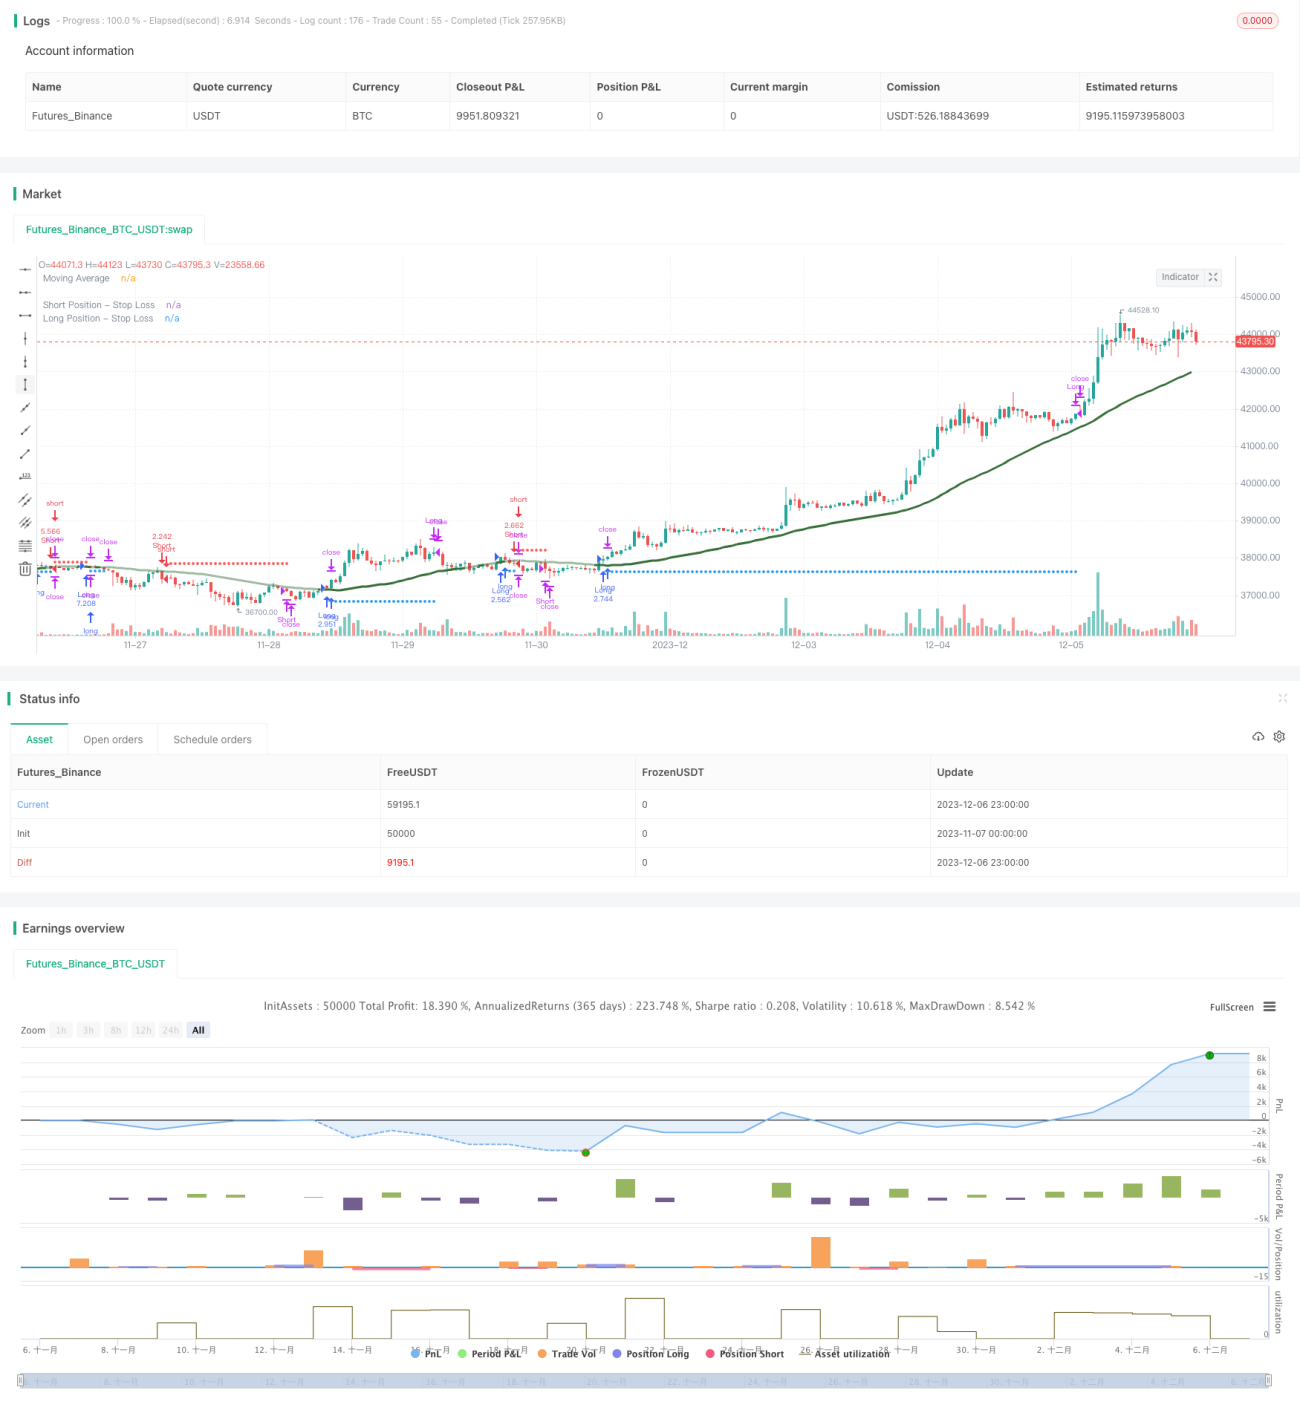
Strategi ini menggunakan k Near Neighborhood (kNN) algoritma pembelajaran mesin untuk memprediksi tren pasar, dan berdasarkan hasil prediksi menghasilkan sinyal posisi panjang dan posisi kosong. Strategi ini secara komprehensif mempertimbangkan beberapa faktor seperti data historis, indikator teknis, dan lain-lain.
Prinsip Strategi
-
Mengumpulkan data pelatihan: mengumpulkan urutan waktu seperti harga close out historis, volume transaksi, dan indikator teknis seperti RSI, CCI.
-
Pengolahan data: mengevaluasi nilai indikator dalam kisaran 0-100
-
Pelatihan model kNN: Masukkan dua karakteristik dari model kNN saat ini, hitung jarak Eropa antara vektor karakteristik ini dan vektor karakteristik sejarah, pilih jarak dari k sampel sejarah terdekat, dan statistikkan distribusi label k sampel ini:
-
Dapatkan prediksi: memprediksi tren pasar saat ini berdasarkan label dari k sampel terdekat. Jika prediksi adalah multipel, menghasilkan sinyal long position; Jika prediksi adalah kosong, menghasilkan sinyal kosong.
-
Perdagangan dengan filter seperti stop loss, kontrol posisi, dan moving average.
Keunggulan Strategis
-
Algoritma pembelajaran mesin digunakan untuk mengidentifikasi bentuk teknologi secara otomatis, tanpa intervensi manusia.
-
Fleksibilitas dalam memilih indikator teknis yang berbeda sebagai fitur model, dan strategi optimasi real-time.
-
Mengintegrasikan mekanisme pengendalian risiko yang ketat seperti penghentian kerugian, manajemen posisi.
-
Visualisasi menampilkan garis stop loss, jelas dan intuitif.
Risiko dan Solusi
-
Prediksi pembelajaran mesin dapat menimbulkan kesalahan. Model optimasi seperti nilai k, vektor karakteristik, dan rentang waktu sampel yang sesuai dapat dipilih.
-
Ada potensi risiko transaksi unilateral. Anda dapat menambahkan transaksi bilateral ke dalam kode untuk menghilangkan bug.
-
Parameter yang tidak tepat dapat menyebabkan perdagangan berlebihan. Harus disesuaikan dengan ukuran posisi, frekuensi perdagangan dan parameter lainnya.
Arah optimasi
-
Uji berbagai jenis indikator teknis sebagai karakteristik input kNN.
-
Cobalah metode pengukuran jarak lainnya, seperti jarak Manhattan.
-
Ukuran posisi disesuaikan dengan jarak sampel atau klasifikasi kualitas.
-
Tambahkan set latihan model, subdivisi set uji, dan optimasi scrolling.
Meringkaskan
Strategi ini menggunakan algoritma klasik kNN untuk memprediksi tren pasar dan melakukan perdagangan sesuai dengan sinyal yang diprediksi. Strategi ini memiliki parameter yang dapat disesuaikan, risiko yang dapat dikontrol, dan dapat memberikan solusi perdagangan otomatis yang efektif bagi pengguna. Pengguna dapat terus meningkatkan kinerja strategi dengan cara menyesuaikan portofolio indikator teknis, mengoptimalkan model overparameter, dll.
- 1