Strategi bom super trend engulfing

Ringkasan
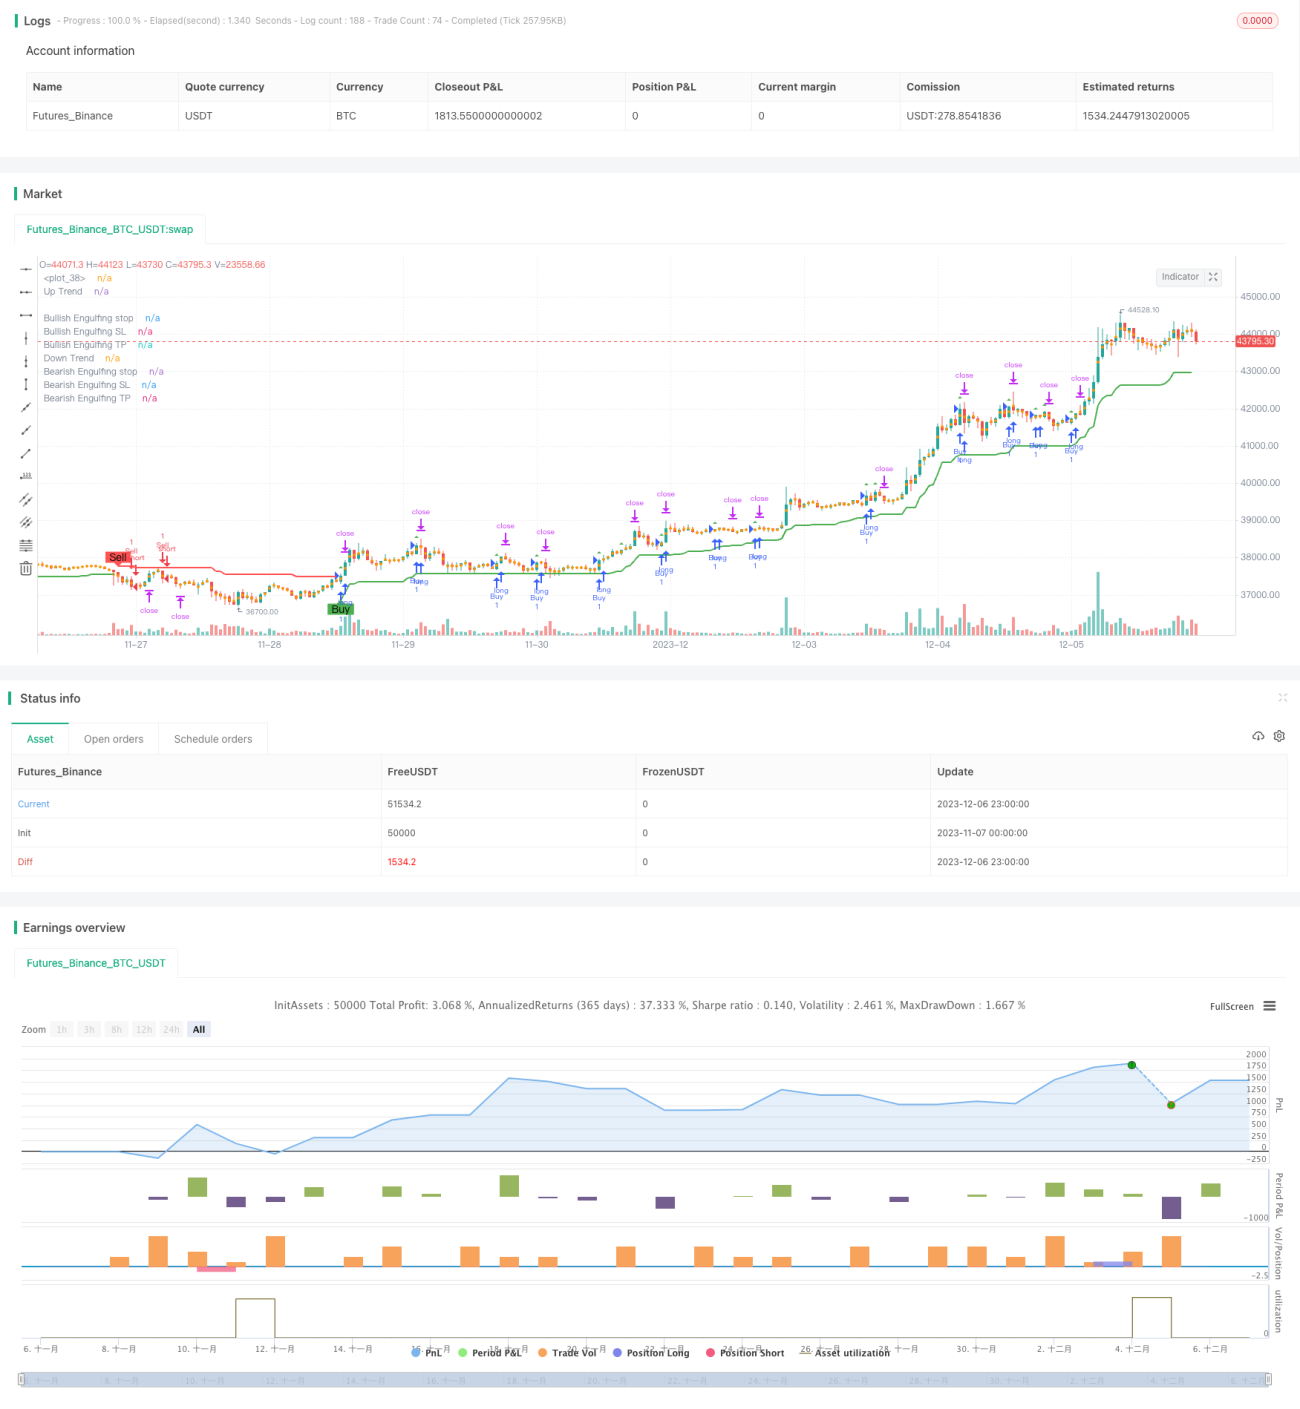
Strategi overtrend swallowing adalah strategi pelacakan tren yang menggabungkan rata-rata real amplitude (ATR), indikator overtrend, dan bentuk swallowing untuk mengidentifikasi arah tren, dan mencari peluang masuk dengan rasio yang menguntungkan sambil mengkonfirmasi tren dalam bentuk swallowing.
Prinsip Strategi
Strategi ini pertama-tama menggunakan ATR dan indikator supertrend untuk menentukan arah tren pasar saat ini. Secara khusus, ini didefinisikan sebagai tren turun ketika harga berada di bawah tren atas dan tren naik ketika harga berada di atas tren bawah.
Strategi juga menilai apakah K-line membentuk bentuk penyelundupan. Menurut logika kode, dalam tren naik, penyelundupan kepala kosong akan dipicu oleh situasi di mana K-line sebelumnya ditutup dengan harga lebih tinggi dari harga K-line saat ini dan ditutup dengan harga K-line saat ini di bawah harga pembukaan. Dalam tren turun, penyelundupan kepala kosong akan dipicu oleh situasi di mana K-line sebelumnya ditutup dengan harga lebih rendah dari K-line saat ini dan ditutup dengan harga K-line saat ini di atas harga pembukaan.
Ketika bentuk penetrasi sesuai dengan arah tren, sinyal perdagangan dihasilkan. Selain itu, strategi juga akan menghitung harga stop loss dan harga stop berdasarkan bentuk penetrasi. Setelah masuk, jika harga menyentuh harga stop loss atau stop loss, maka akan keluar dari posisi saat ini.
Analisis Keunggulan
Strategi ini menggabungkan keuntungan dari pelacakan tren dan pengenalan pola, dapat mengidentifikasi sinyal reversal dalam tren, sehingga menangkap tren yang lebih besar di titik-titik perubahan pasar. Selain itu, mekanisme stop loss juga dapat secara efektif mengendalikan risiko kerugian.
Analisis risiko
Risiko terbesar dari strategi ini adalah bahwa bentuk penelan mungkin palsu, sehingga menghasilkan sinyal yang salah. Selain itu, pengaturan stop loss dan stop loss mungkin terlalu arbitrer dan tidak dapat mencapai keseimbangan untung-rugi. Disarankan untuk mengoptimalkan kombinasi parameter dan menyesuaikan posisi stop loss dengan tepat.
Arah optimasi
Parameter ATR dapat dipertimbangkan untuk dioptimalkan secara real-time untuk menangkap perubahan volatilitas pasar dengan lebih baik. Selain itu, indikator lain dapat dipelajari untuk mengidentifikasi tren dan meningkatkan stabilitas strategi lebih lanjut.
Meringkaskan
Strategi penelan lonjakan supertrend mengintegrasikan keuntungan dari pelacakan tren dan identifikasi pola, strategi penelan pola sebagai sinyal pembalikan, dapat memperoleh efisiensi yang lebih tinggi pada titik pivot pasar. Namun, strategi ini juga memiliki risiko sinyal palsu tertentu yang perlu diuji dan dioptimalkan lebih lanjut untuk mengendalikan risiko.
- 1