Strategi mengikuti tren berdasarkan stop loss EMA dan ATR

1
Follow
1779
Followers
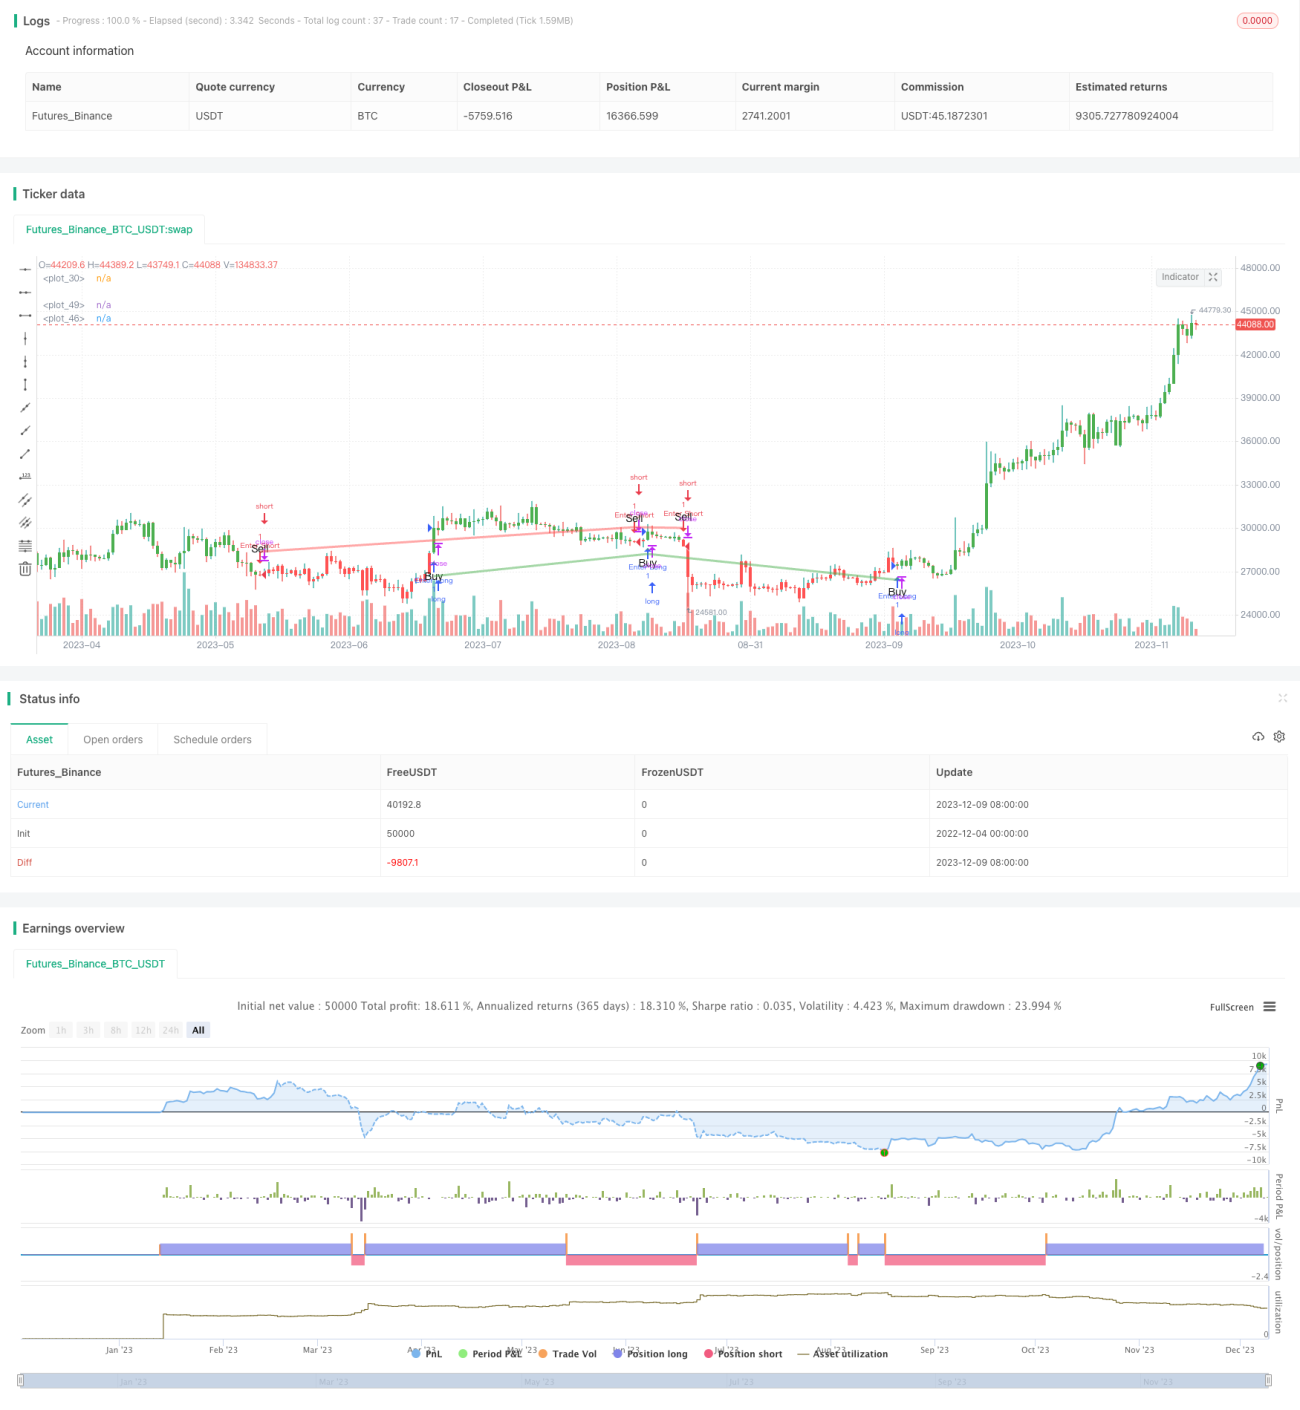
Ringkasan
Strategi ini menggunakan EMA rata-rata golden cross untuk menghasilkan sinyal perdagangan, yaitu sinyal beli ketika melewati EMA lambat di EMA cepat, dan sinyal jual ketika melewati EMA lambat di EMA cepat. Strategi ini merupakan strategi pelacakan tren yang khas.
Prinsip Strategi
- Definisi EMA rata-rata cepat adalah 13, EMA rata-rata lambat adalah 48.
- Ketika EMA cepat melewati EMA lambat, menghasilkan sinyal beli; ketika EMA cepat melewati EMA lambat, menghasilkan sinyal jual.
- Fungsi ta.crossover dan ta.crossunder untuk menentukan forks linear.
- Dengan menggunakan indikator ATR untuk menghitung stop loss dinamis, stop loss adalah 1.5 kali ATR dari jarak dekat.
- Sinyal perdagangan dan stop loss ditampilkan secara visual melalui perubahan warna, tanda jual beli, dan garis stop loss.
Analisis Keunggulan Strategi
- Gold Fork Dead Fork yang didasarkan pada garis rata-rata EMA menghasilkan sinyal, menghindari kehilangan tren utama pasar, dan mendapatkan keuntungan yang cukup besar.
- ATR Dynamic Tracking Stop Loss, memastikan keuntungan yang cukup baik, tetapi juga mengendalikan risiko penarikan, dan keuntungan dari risiko secara keseluruhan lebih seimbang.
- Tampilan sinyal dan stop loss yang intuitif, mudah dioperasikan, dan cocok untuk kebanyakan orang.
- Parameter yang dapat disesuaikan lebih sedikit, mudah dipelajari dan dioptimalkan.
Analisis Risiko Strategi
- Kejadian tak terduga dapat memicu penurunan harga.
- Dalam situasi gempa bumi, sinyal tidak aktif dapat sering dihasilkan.
- Penetapan parameter yang tidak tepat dapat menyebabkan terlalu keras masuk ke lapangan atau stop loss terlalu longgar.
- Parameter EMA dan ATR harus dioptimalkan dengan tepat.
Solusi:
- ATR dapat dilepaskan secara tepat untuk memastikan bahwa ada penyangga dari stop loss ke titik tertinggi terdekat.
- Mekanisme konfirmasi dapat dipertimbangkan setelah munculnya sinyal, seperti harga sebelum mencapai titik tertinggi.
- Optimasi parameter disarankan untuk mempertimbangkan berbagai situasi pasar secara menyeluruh.
Arah optimasi strategi
- Anda dapat menguji kombinasi parameter yang berbeda untuk menemukan yang terbaik.
- Anda dapat mempertimbangkan untuk menambahkan indikator lain untuk memfilter sinyal, seperti indikator volume transaksi, indikator tingkat fluktuasi, dan sebagainya, untuk meningkatkan kualitas sinyal.
- Parameter EMA dapat disesuaikan dengan tren skala besar untuk menangkap tren utama.
- Anda dapat mempertimbangkan untuk secara dinamis menyesuaikan ATR stop loss multiplier dan memperluas stop loss dalam situasi tren.
- Parameter optimasi yang dapat beradaptasi dengan algoritma pembelajaran mesin.
Meringkaskan
Strategi ini secara keseluruhan relatif sederhana dan mudah digunakan, berdasarkan EMA rata-rata menghasilkan sinyal, karena berurutan, ditambah dengan indikator ATR untuk melacak stop loss, dapat secara efektif mengendalikan risiko. Meskipun akan ada beberapa sinyal palsu, namun kemampuan untuk menangkap tren utama yang kuat, keuntungan yang lebih stabil, cocok sebagai salah satu strategi dasar untuk perdagangan kuantitatif.
Source
Pine
/*backtest
start: 2022-12-04 00:00:00
end: 2023-12-10 00:00:00
period: 1d
basePeriod: 1h
exchanges: [{"eid":"Futures_Binance","currency":"BTC_USDT"}]
*/

// This source code is subject to the terms of the Mozilla Public License 2.0 at https://mozilla.org/MPL/2.0/
// © byee322

/// This strategy uses the EMA to generate buy and sell signals with a 1.5x ATR stop lossStrategy parameters
Related strategies
Comment
All comments (0)
No data
- 1