Strategi Perdagangan Osilator

Ringkasan
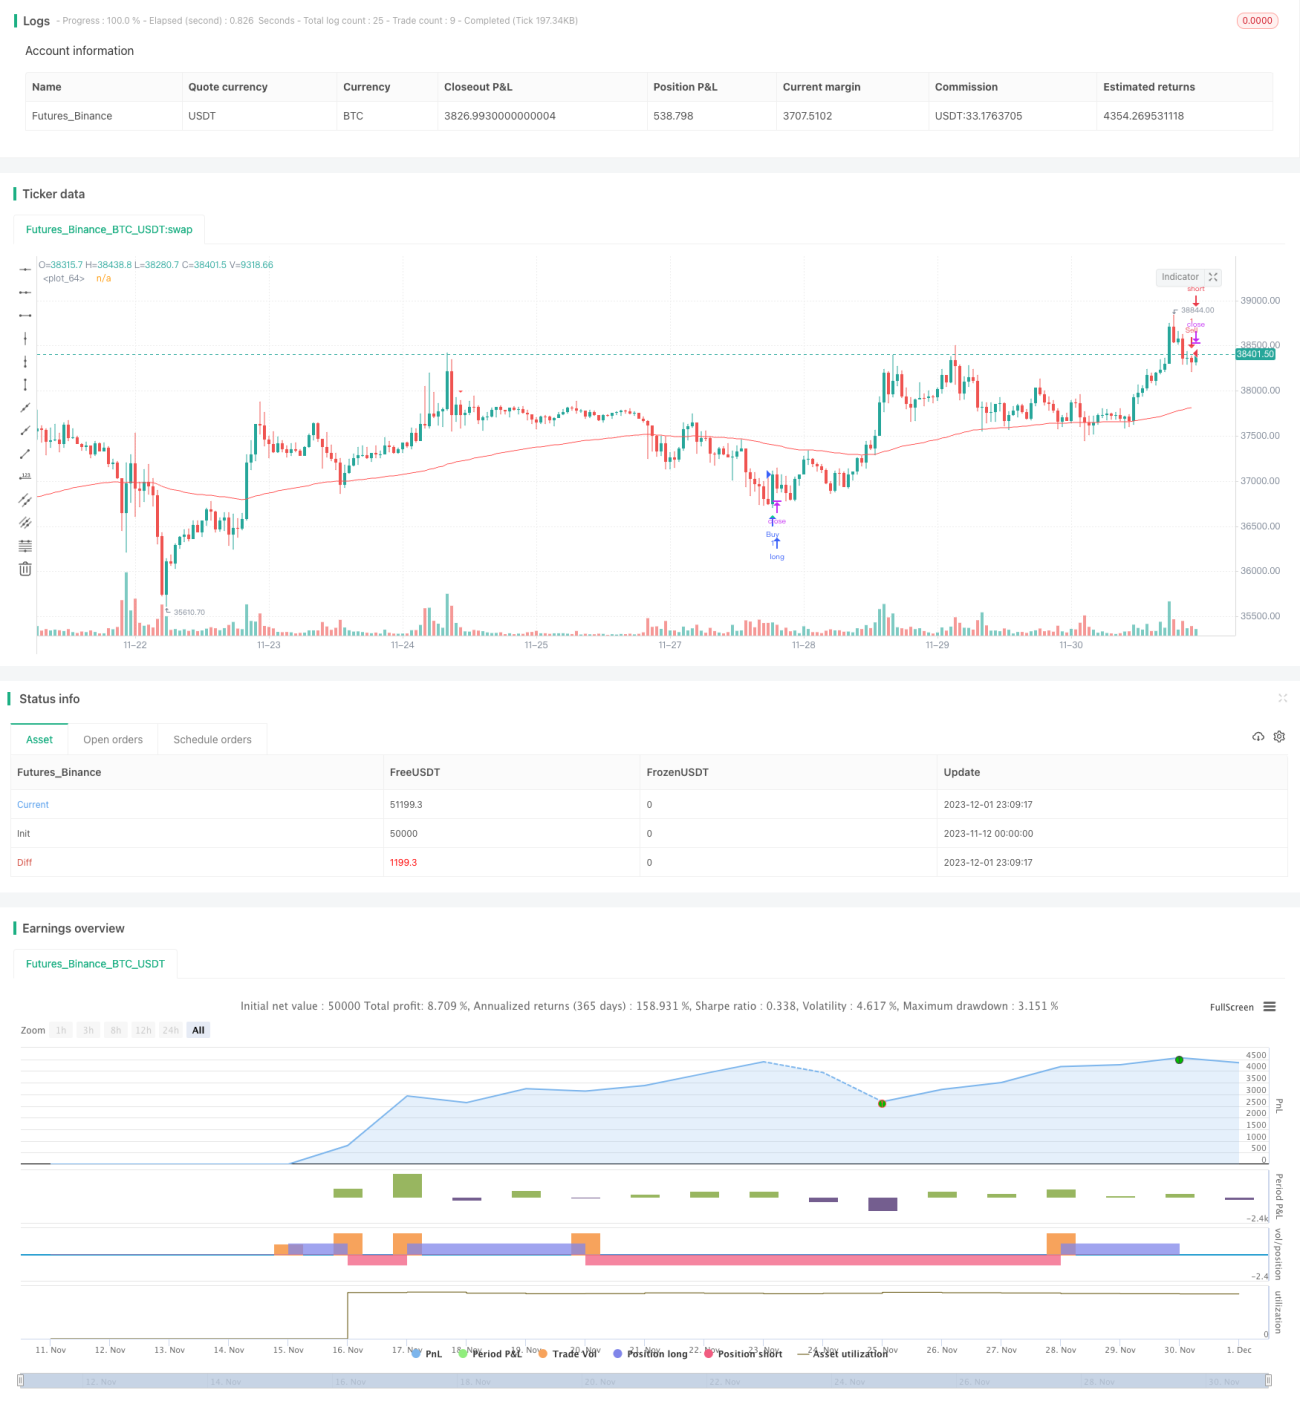
Ini adalah strategi perdagangan berbalik yang didasarkan pada beberapa indikator teknis. Ini menggabungkan indikator seperti CCI, indikator momentum, RSI untuk mengidentifikasi potensi peluang perdagangan overhead dan overhead. Strategi ini akan mengirimkan sinyal perdagangan ketika indikator menunjukkan sinyal overbought dan oversold dan harga muncul.
Prinsip Strategi
Sinyal perdagangan untuk strategi ini berasal dari sebuah indikator yang disesuaikan, yaitu Edri Polar Buy/Sell, yang secara komprehensif mempertimbangkan persilangan CCI, momentum, dan RSI. Logika spesifiknya adalah:
Kondisi sinyal multihead:
- Indikator Edri Polar Buys and Sells Polar Sells memberikan sinyal beli, yaitu CCI melewati 0 pada sumbu atau momentum melewati 0 pada sumbu, dan RSI berada di bawah garis oversold.
- Harga menarik kembali atau di bawah 100 siklus EMA.
Kondisi sinyal kosong:
- Indikator Edri Polar Buy/Sell Polar Selling Indikator memberikan sinyal jual, yaitu CCI di bawah garis 0 atau Indikator Momentum di bawah garis 0 dan RSI lebih tinggi dari garis overbought.
- Harga menarik kembali atau lebih tinggi dari 100 siklus EMA.
Strategi ini juga dapat dikonfigurasi untuk mencari kondisi deviasi konvensional, yaitu RSI dan harga deviasi yang jelas untuk menghasilkan sinyal perdagangan.
Ketika sinyal perdagangan terpenuhi, titik stop loss strategi adalah harga masuk ± 2ATR dan titik stop loss adalah harga masuk ± 4ATR. Ini dapat mengatur batas stop loss yang wajar sesuai dengan tingkat fluktuasi pasar.
Analisis Keunggulan
- Pertimbangan dari beberapa indikator dapat membantu menghindari sinyal palsu dari satu indikator.
- Metode trading inverse, yang membantu menangkap peluang trading short-line dalam situasi yang bergejolak.
- ATR Stop Loss Stop Stop Mode, dapat menyesuaikan posisi berdasarkan volatilitas pasar yang cerdas.
- Anda dapat menemukan kondisi yang menyimpang dan menghindari membuka posisi dalam kondisi overbought dan oversold yang tidak ekstrim.
Analisis risiko
- Setting parameter indikator yang tidak tepat dapat menyebabkan kehilangan peluang perdagangan atau menghasilkan terlalu banyak sinyal yang salah.
- Modus reverse trading dapat mengalami stop loss berturut-turut dalam kondisi tren.
- ATR memiliki keterlambatan dan tidak dapat memperbarui stop loss dalam waktu yang tepat dalam situasi yang berubah dengan cepat.
Solusi:
- Parameter indikator diuji dan dioptimalkan beberapa kali untuk menemukan kombinasi parameter yang optimal.
- Strategi ini dapat dipertimbangkan untuk dihentikan pada saat tren lebih kuat.
- Kombinasi dengan metode stop loss lainnya, seperti stop loss bergerak atau stop loss melawan.
Arah optimasi
- Uji kombinasi parameter yang berbeda, seperti siklus CCI dan momentum, parameter RSI, ATR, dll.
- Menambahkan kondisi penyaringan tambahan, seperti pola harga, perubahan volume transaksi, dan sebagainya.
- Menyesuaikan cara manajemen posisi, seperti menetapkan rasio posisi berdasarkan nilai ATR.
- Templat parameter untuk berbagai varietas, periode.
- Pertimbangkan untuk menghentikan perdagangan reversal di tengah tren, dengan menggunakan mekanisme pelacakan tren.
Meringkaskan
Strategi ini terutama diterapkan pada situasi yang bergolak, untuk mendapatkan keuntungan yang lebih stabil dengan menangkap pembalikan garis pendek di tengah. Ini membantu untuk mengidentifikasi fenomena harga jangka pendek dan menghasilkan sinyal perdagangan berdasarkan beberapa penilaian indikator. Dengan optimasi parameter yang masuk akal dan manajemen risiko, keuntungan dari strategi ini dapat dimanfaatkan secara efektif.
- 1