
Strategi ini menggunakan indikator pita ganda untuk mengidentifikasi area yang berbalik, dan berkolaborasi dengan strategi penembusan untuk mencapai strategi perdagangan yang lebih murah dan lebih murah. Ketika harga menembus zona netral, ini menunjukkan bahwa harga mulai memulai tren baru, ketika masuk lebih banyak; Ketika harga jatuh ke zona netral lagi, ini menunjukkan bahwa tren harga berakhir, ketika posisi terjalin.
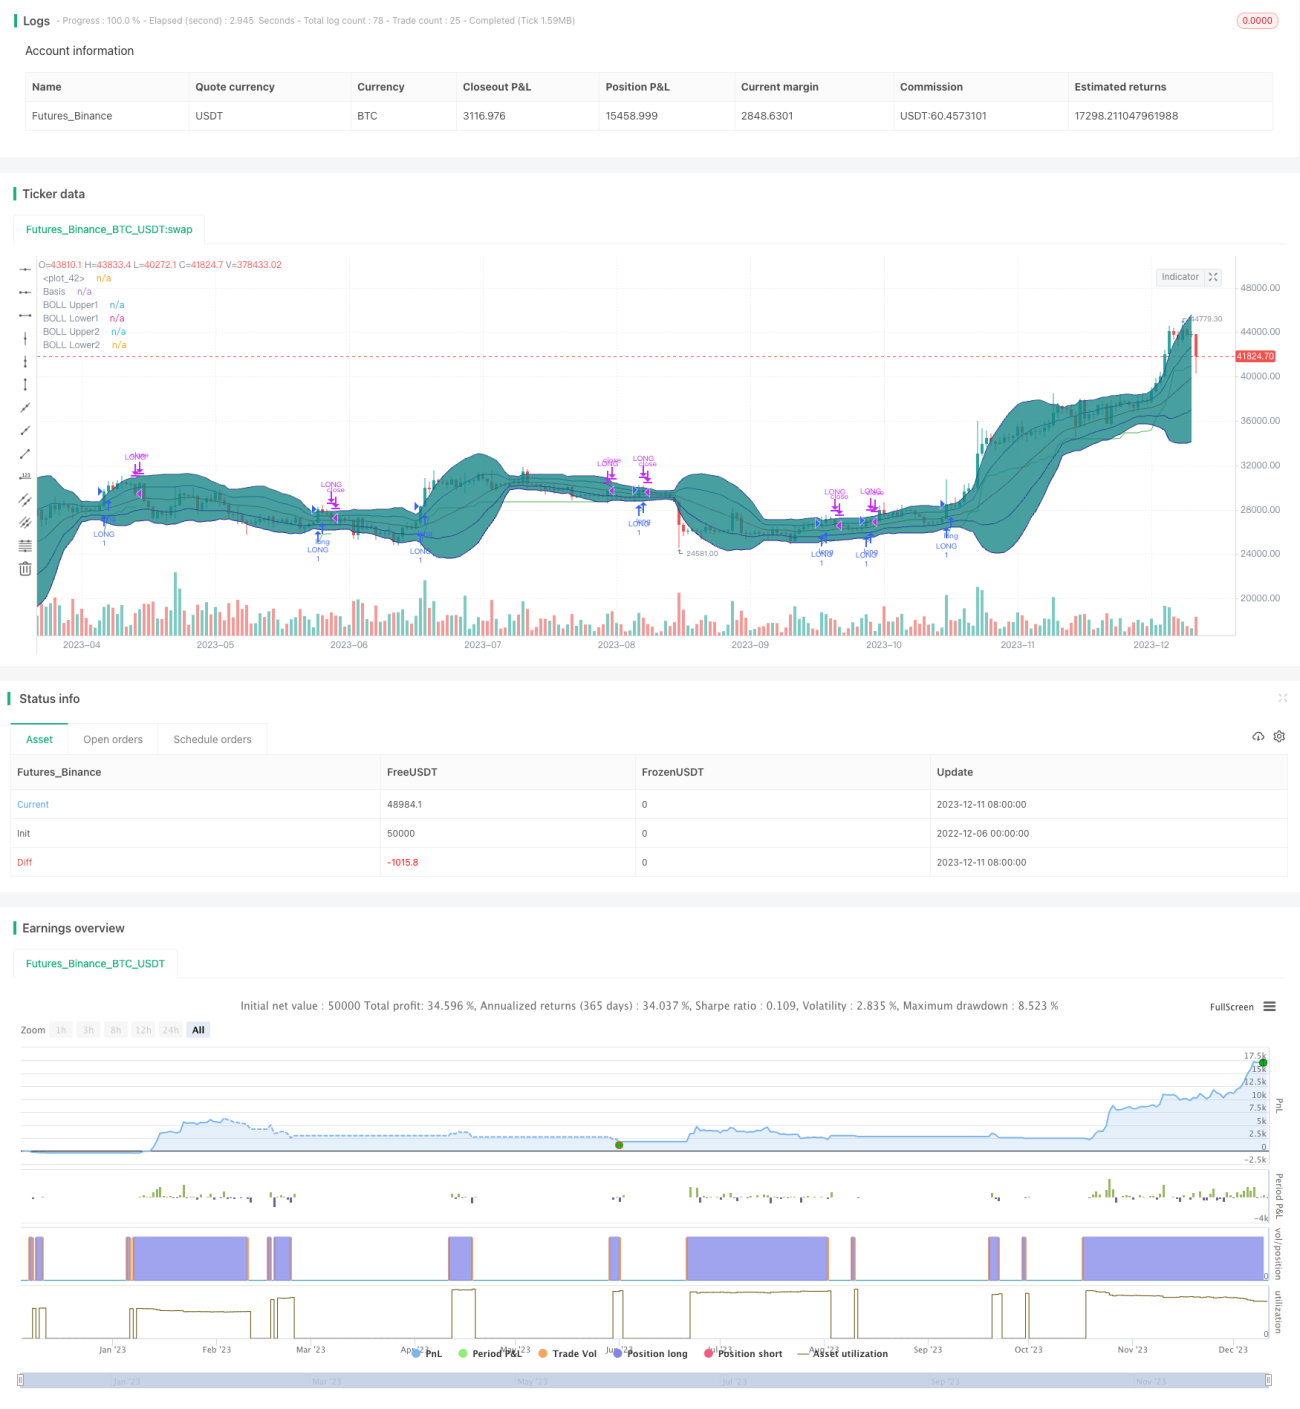
Strategi ini menggunakan dua Bollinger Bands. Bollinger Bands internal memiliki lintasan atas dan bawah yang memiliki rata-rata bergerak sederhana 20 hari ± 1 kali selisih standar. Bollinger Bands eksternal memiliki lintasan atas dan bawah yang memiliki rata-rata bergerak sederhana 20 hari ± 2 kali selisih standar.
Ketika harga dua garis K berturut-turut berada di zona netral, dianggap berada di perpindahan; Ketika harga dua garis K berturut-turut di perpindahan, K garis ketiga harga penutupan lebih dari Neoburin band di jalur, menghasilkan sinyal melakukan banyak.
Setelah melakukan over, setel stop loss pada harga minimum - 2 kali ATR untuk mengunci keuntungan dan mengendalikan risiko; tutup posisi ketika harga turun di bawah jalur Nebrill.
Strategi ini menggabungkan dua faktor, indikator dan tren, untuk mengidentifikasi area perombakan dan menentukan apakah harga memulai putaran baru tren, untuk mencapai harga rendah dan harga tinggi, ruang untuk keuntungan besar. Strategi stop loss dapat mengunci keuntungan dan mengendalikan risiko, sehingga stabilitas strategi lebih tinggi.
Strategi ini bergantung pada sinyal ganda yang terbentuk saat harga menembus Bollinger Bands, dan jika terjadi penembusan palsu, maka akan terjadi kesalahan dan kerugian. Selain itu, stop loss yang terlalu dekat juga dapat dihentikan.
Probabilitas false breakout dapat dikurangi dengan cara mengoptimalkan parameter Brin Belt, meningkatkan kondisi filter, dan lain-lain. Selain itu, titik-titik penghentian dapat dilepas dengan tepat untuk memastikan ada ruang yang cukup.
Strategi ini mengintegrasikan indikator dual band dan strategi tren, untuk mencapai harga rendah dan harga tinggi, ruang keuntungan besar. Pada saat yang sama, strategi stop loss juga membuat strategi lebih stabil. Dengan pengoptimalan lebih lanjut, dapat meningkatkan efektivitas strategi, layak untuk diuji di lapangan.
/*backtest
start: 2022-12-06 00:00:00
end: 2023-12-12 00:00:00
period: 1d
basePeriod: 1h
exchanges: [{"eid":"Futures_Binance","currency":"BTC_USDT"}]
*/
// This source code is subject to the terms of the Mozilla Public License 2.0 at https://mozilla.org/MPL/2.0/
// © DojiEmoji
//@version=4
strategy("[KL] Double BB Strategy",overlay=true,pyramiding=1)
ENUM_LONG = "LONG"
// Timeframe {
backtest_timeframe_start = input(defval = timestamp("01 Apr 2020 13:30 +0000"), title = "Backtest Start Time", type = input.time)
USE_ENDTIME = input(false,title="Define backtest end-time (If false, will test up to most recent candle)")
backtest_timeframe_end = input(defval = timestamp("19 Apr 2021 19:30 +0000"), title = "Backtest End Time (if checked above)", type = input.time)
within_timeframe = true
// }
// Bollinger bands
BOLL_length = 20, BOLL_src = close, SMA20 = sma(BOLL_src, BOLL_length)
BOLL_sDEV = stdev(BOLL_src, BOLL_length)
BOLL_upper1 = SMA20 + BOLL_sDEV, BOLL_lower1 = SMA20 - BOLL_sDEV
BOLL_upper2 = SMA20 + BOLL_sDEV*2, BOLL_lower2 = SMA20 - BOLL_sDEV*2
SMA_20_plot = plot(SMA20, "Basis", color=#872323, offset = 0)
BOLL_upper1_plot = plot(BOLL_upper1, "BOLL Upper1", color=color.navy, offset = 0, transp=50)
BOLL_lower1_plot = plot(BOLL_lower1, "BOLL Lower1", color=color.navy, offset = 0, transp=50)
BOLL_upper2_plot = plot(BOLL_upper2, "BOLL Upper2", color=color.navy, offset = 0, transp=50)
BOLL_lower2_plot = plot(BOLL_lower2, "BOLL Lower2", color=color.navy, offset = 0, transp=50)
fill(BOLL_upper2_plot, BOLL_upper1_plot, title = "Background", color=#198787, transp=85)
fill(BOLL_upper1_plot, SMA_20_plot, title = "Background", color=#198787, transp=75)
fill(SMA_20_plot, BOLL_lower1_plot, title = "Background", color=#198787, transp=75)
fill(BOLL_lower1_plot, BOLL_lower2_plot, title = "Background", color=#198787, transp=85)
// Trailing stop loss {
ATR_X2_TSL = atr(input(14,title="Length of ATR for trailing stop loss")) * input(2.0,title="ATR Multiplier for trailing stop loss",type=input.float)
TSL_source = low
var stop_loss_price = float(0)
TSL_line_color = color.green, TSL_transp = 100
if strategy.position_size == 0 or not within_timeframe
TSL_line_color := color.black
stop_loss_price := TSL_source - ATR_X2_TSL
else if strategy.position_size > 0
stop_loss_price := max(stop_loss_price, TSL_source - ATR_X2_TSL)
TSL_transp := 0
plot(stop_loss_price, color=color.new(TSL_line_color, TSL_transp))
// }
// Signals for entry
is_neutral = close < BOLL_upper1 and close > BOLL_lower2
is_consol = is_neutral and is_neutral[2]
entry_signal = is_consol[1] and close > BOLL_upper1
// MAIN:
if within_timeframe
// EXIT ::::::::::::::::::::::::::::::::::::::::::::::::::::::::::::::::::::
exit_msg = close <= strategy.position_avg_price ? "stop loss" : "take profit"
end_of_rally = close < BOLL_upper1 and strategy.position_avg_price > stop_loss_price // also detects false breakouts
if strategy.position_size > 0 and (TSL_source <= stop_loss_price or end_of_rally)
strategy.close(ENUM_LONG, comment=exit_msg)
// ENTRY :::::::::::::::::::::::::::::::::::::::::::::::::::::::::::::::::::
if (strategy.position_size == 0 or (strategy.position_size > 0 and close > stop_loss_price)) and entry_signal
entry_msg = strategy.position_size > 0 ? "adding" : "initial"
strategy.entry(ENUM_LONG, strategy.long, comment=entry_msg)
// CLEAN UP:
if strategy.position_size == 0
stop_loss_price := float(0)