Strategi pembalikan titik rendah

1
Follow
1779
Followers
Ringkasan
Strategi ini adalah strategi untuk melakukan operasi reversal berdasarkan titik terendah di pasar. Ini menggunakan titik terendah dari 200 hari EMA, dikombinasikan dengan resistance level dukungan Kamala untuk menentukan titik terendah di pasar, dan melakukan lebih banyak operasi ketika harga bangkit.
Prinsip Strategi
- EMA200Lows, yang dianggap berada di dekat titik terendah pasar ketika harga ditutup di bawah EMA tersebut.
- EMA hari ke-9 untuk Kamelareta Support 3 (S3) adalah ema_s3_9, yang digunakan sebagai support penting.
- Kemudian menghitung EMA 9 hari di pusat Camarela, atau ema_center_9, sebagai sinyal untuk menentukan pembalikan.
- Bila ema_center_9 memakai ema200Lows, dan 3 baris K terdahulu berada di bawah ema200Lows, lakukan beberapa operasi.
- Stop loss adalah stop loss ATR dan melacak pergerakan harga minimum.
- Profit target adalah ema_h4_9 ((resistensi camarella 4) dan ema_s3_9 ((dukungan camarella 3) <unk>
Analisis Keunggulan
- Gunakan titik terendah EMA 200 hari untuk menentukan area terendah pasar, hindari titik lebih rendah di tengah jalan.
- Di sisi lain, di sisi lain, di sisi lain, di sisi lain, di sisi lain.
- ATR stop loss membuat stop loss lebih masuk akal, lebih menguntungkan untuk melacak titik rendah dan lebih menguntungkan untuk mengunci mata uang.
Analisis risiko
- Strategi ini lebih cocok untuk operasi garis pendek.
- Stop loss mungkin lebih besar dalam kondisi pasar yang lebih besar. Dapat disesuaikan dengan parameter ATR.
- Di sisi lain, penghakiman terbalik Camaleira tidak selalu 100% dapat diandalkan, dan bisa saja terjadi kesalahan penghakiman.
Arah optimasi
- Anda dapat mempertimbangkan untuk mengevaluasi sinyal reversal dengan menggunakan indikator lain, seperti RSI.
- Parameter yang disesuaikan untuk varietas yang berbeda dapat dipelajari untuk mencari parameter yang lebih baik.
- Metode pembelajaran mesin dapat dicoba untuk secara dinamis menyesuaikan kerusakan ATR.
Meringkaskan
Strategi ini menggunakan titik terendah EMA dengan indikator Camarela untuk menentukan area terendah pasar dan titik balik. Mengambil keuntungan melalui ATR Stop Loss. Secara keseluruhan, strategi ini lebih lengkap dan memiliki nilai nyata. Dengan pengoptimalan lebih lanjut di kemudian hari, strategi dapat dibuat lebih stabil dan dapat diandalkan.
Source
Pine
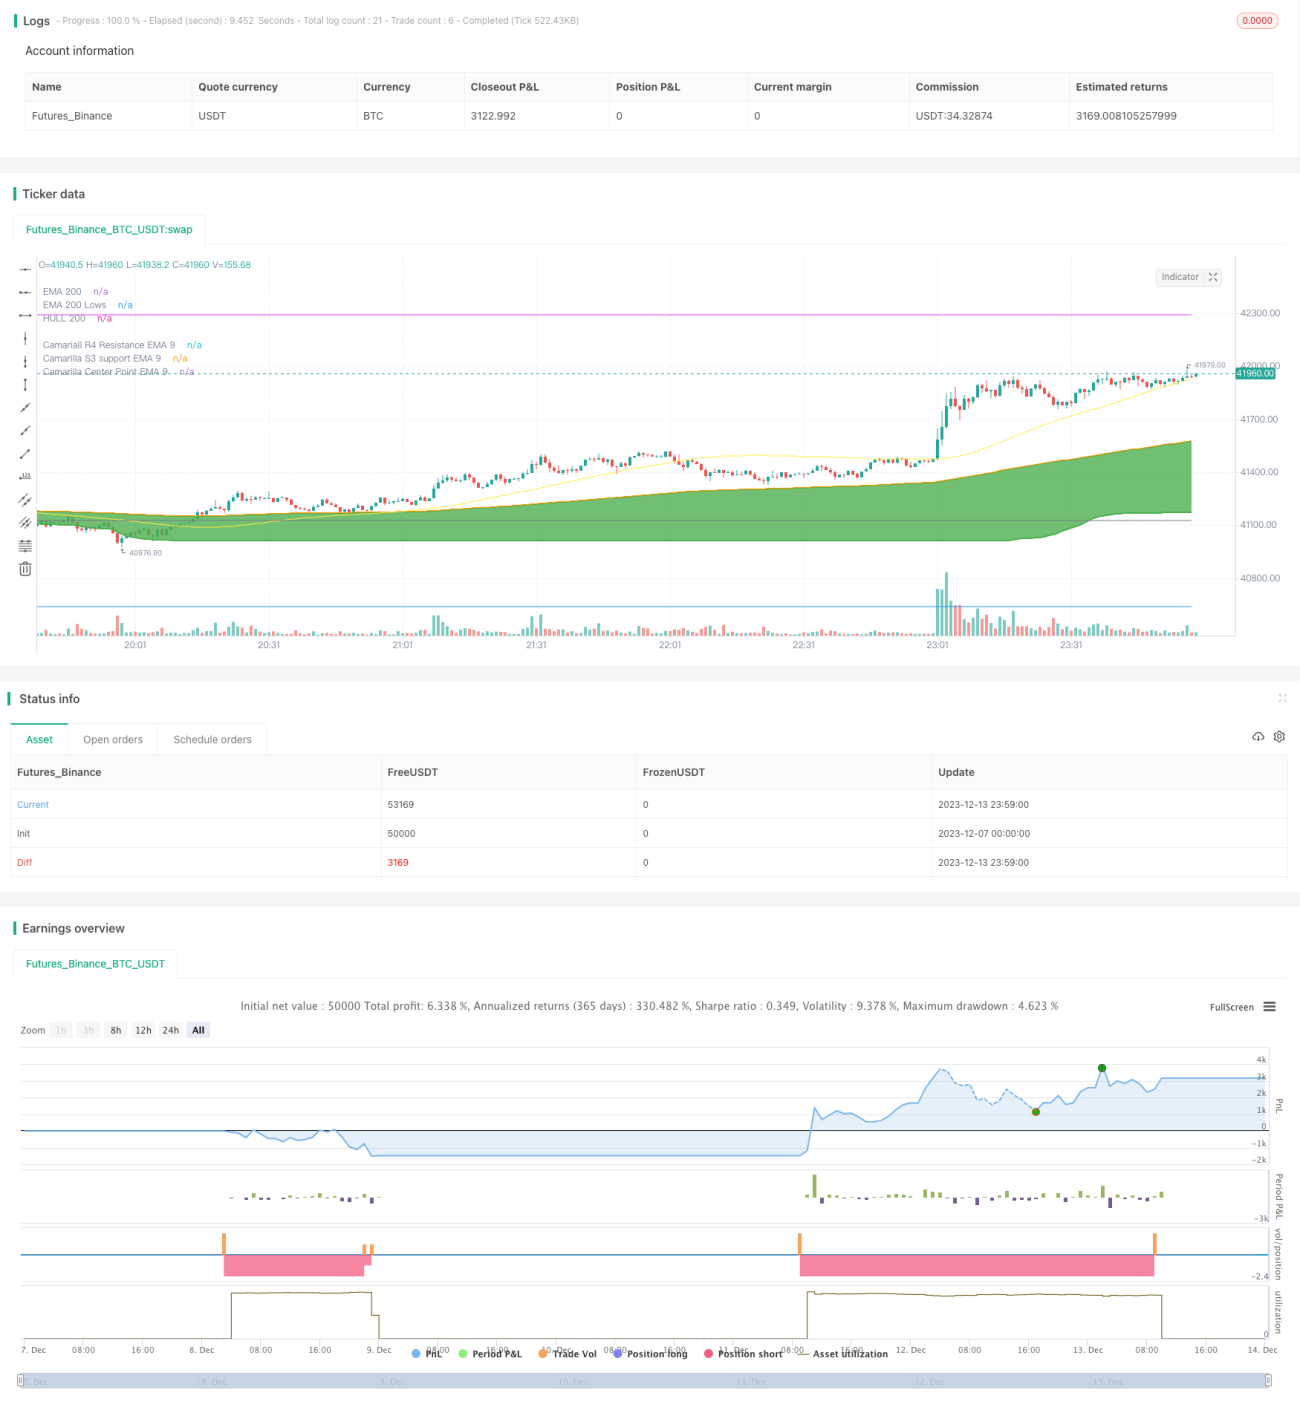
/*backtest
start: 2023-12-07 00:00:00
end: 2023-12-14 00:00:00
period: 1m
basePeriod: 1m
exchanges: [{"eid":"Futures_Binance","currency":"BTC_USDT"}]
*/

// This source code is subject to the terms of the Mozilla Public License 2.0 at https://mozilla.org/MPL/2.0/
// © mohanee

//Using the lowest of low of ema200, you can find the bottomStrategy parameters
Related strategies
Comment
All comments (0)
No data
- 1